As filed with the Securities and Exchange Commission on September 22, 2016
Registration No. 333-213504
UNITED STATES
SECURITIES AND EXCHANGE COMMISSION
WASHINGTON, D.C. 20549
AMENDMENT NO. 1
TO
FORM S-1
REGISTRATION STATEMENT
UNDER
THE SECURITIES ACT OF 1933
Mammoth Energy Services, Inc.
(Exact name of registrant as specified in its charter)
| Delaware | 1389 | 32-0498321 | ||
| (State or other jurisdiction of incorporation or organization) |
(Primary Standard Industrial Classification Code Number) |
(I.R.S. Employer Identification Number) |
4727 Gaillardia Parkway, Suite 200
Oklahoma City, OK 73142
(405) 608-6007
(Address, including zip code and telephone number, including area code, of registrant’s principal executive offices)
Mark Layton
Chief Financial Officer
Mammoth Energy Services, Inc.
4727 Gaillardia Parkway, Suite 200
Oklahoma City, OK 73142
(405) 608-6007
(Name, address, including zip code and telephone number, including area code, of agent for service)
Copies to:
| Seth R. Molay, P.C. Akin Gump Strauss Hauer & Feld LLP 1700 Pacific Avenue, Suite 4100 Dallas, TX 75201 (214) 969-4780 |
J. Michael Chambers Latham & Watkins LLP 811 Main Street, Suite 3700 Houston, TX 77002 (713) 546-5000 |
Approximate date of commencement of proposed sale to the public: As soon as practicable after this Registration Statement is declared effective.
If any securities being registered on this form are to be offered on a delayed or continuous basis pursuant to Rule 415 under the Securities Act of 1933, as amended (the “Securities Act”), check the following box. ¨
If this form is filed to register additional securities for an offering pursuant to Rule 462(b) under the Securities Act, check the following box and list the Securities Act registration statement number of the earlier effective registration statement for the same offering. ¨
If this form is a post-effective amendment filed pursuant to Rule 462(c) under the Securities Act, check the following box and list the Securities Act registration statement number of the earlier effective registration statement for the same offering. ¨
If this form is a post-effective amendment filed pursuant to Rule 462(d) under the Securities Act, check the following box and list the Securities Act registration statement number of the earlier effective registration statement for the same offering. ¨
Indicate by check mark whether the registrant is a large accelerated filer, an accelerated filer, a non-accelerated filer, or a smaller reporting company. See the definitions of “large accelerated filer,” “accelerated filer” and “smaller reporting company” in Rule 12b-2 of the Exchange Act. (Check one):
| Large accelerated filer | ¨ | Accelerated filer | ¨ | |||
| Non-accelerated filer | x (Do not check if a smaller reporting company) | Smaller reporting company | ¨ | |||
The Registrant hereby amends this Registration Statement on such date or dates as may be necessary to delay its effective date until the Registrant shall file a further amendment which specifically states that this Registration Statement shall thereafter become effective in accordance with Section 8(a) of the Securities Act or until this Registration Statement shall become effective on such date as the Commission, acting pursuant to said Section 8(a), may determine.
The information in this prospectus is not complete and may be changed. We and the selling stockholders may not sell the securities described herein until the registration statement filed with the Securities and Exchange Commission is effective. This prospectus is not an offer to sell such securities and it is not soliciting an offer to buy such securities in any state where such offer or sale is not permitted.
Subject to Completion, Dated September 22, 2016.
Shares
Mammoth Energy Services, Inc.
Common Stock
This is the initial public offering of our common stock. Prior to this offering, there has been no public market for our common stock. We are offering shares of our common stock in this offering. The selling stockholders identified in this prospectus are offering an additional shares of our common stock in this offering. We will not receive any of the proceeds from the sale of the shares by the selling stockholders.
We anticipate that the initial public offering price of our common stock will be between $ and $ per share. We have applied for listing of our common stock on The NASDAQ Global Market under the symbol “TUSK.”
The underwriters have an option to purchase an additional shares of our common stock, of which shares would be sold by us and shares would be sold by the selling stockholders.
Each of the selling stockholders in this offering is deemed to be an underwriter within the meaning of Section 2(a)(11) of the Securities Act of 1933, as amended.
We are an “emerging growth company” under applicable Securities and Exchange Commission rules and will be subject to reduced public company reporting requirements.
Investing in our common stock involves risks. See “Risk Factors” beginning on page 15.
| Price to Public |
Underwriting Discounts and Commissions(1) |
Proceeds to Mammoth Energy (before expenses) |
Proceeds to Selling Stockholders (before expenses) |
|||||||||||||
| Per Share |
$ | $ | $ | $ | ||||||||||||
| Total |
$ | $ | $ | $ | ||||||||||||
| (1) | See “Underwriting” for additional information regarding underwriter compensation. |
Delivery of the shares of common stock is expected to be made on or about , 2016 through the book-entry facilities of The Depository Trust Company.
Neither the Securities and Exchange Commission nor any state securities commission has approved or disapproved the securities described herein or determined if this prospectus is truthful or complete. Any representation to the contrary is a criminal offense.
Credit Suisse
The date of this prospectus is , 2016.
| ii |
| 1 |
| 15 | ||||
| 43 | ||||
| 44 | ||||
| 45 | ||||
| 46 | ||||
| 48 | ||||
| 49 | ||||
| MANAGEMENT’S DISCUSSION AND ANALYSIS OF FINANCIAL CONDITION AND RESULTS OF OPERATIONS |
53 | |||
| 70 | ||||
| 95 |
| 103 | ||||
| 110 | ||||
| 112 | ||||
| 116 | ||||
| MATERIAL U.S. FEDERAL INCOME TAX CONSEQUENCES FOR NON-U.S. HOLDERS |
118 | |||
| 122 | ||||
| 128 | ||||
| 128 | ||||
| 128 | ||||
| A-1 | ||||
| F-1 |
i
You should rely only on the information contained in this prospectus. We have not, and the selling stockholders and the underwriters have not, authorized any other person to provide you with information different from that contained in this prospectus. If anyone provides you with different or inconsistent information, you should not rely on it. We, the selling stockholders and the underwriters are only offering to sell, and only seeking offers to buy, our common stock in jurisdictions where offers and sales are permitted.
The information contained in this prospectus is accurate and complete only as of the date of this prospectus. Our business, financial condition, results of operations and prospects may have changed since that date.
This prospectus contains forward-looking statements that are subject to a number of risks and uncertainties, many of which are beyond our control. See “Risk Factors” and “Cautionary Note Regarding Forward-Looking Statements.”
This prospectus includes industry data and forecasts that we obtained from internal company surveys, publicly available information and industry publications and surveys. Our internal research and forecasts are based on management’s understanding of industry conditions, and such information has not been verified by independent sources. Industry publications and surveys generally state that the information contained therein has been obtained from sources believed to be reliable.
We own or have rights to various trademarks, service marks and trade names that we use in connection with the operation of our business. This prospectus may also contain trademarks, service marks and trade names of third parties, which are the property of their respective owners. Our use or display of third parties’ trademarks, service marks, trade names or products in this prospectus is not intended to, and does not imply, a relationship with, or endorsement or sponsorship by us. Solely for convenience, the trademarks, service marks and trade names referred to in this prospectus may appear without the ®, ™ or SM symbols, but such references are not intended to indicate, in any way, that we will not assert, to the fullest extent under applicable law, our rights or the right of the applicable licensor to these trademarks, service marks and trade names.
Unless the context otherwise requires, the information in this prospectus (other than in the historical financial statements) assumes that the underwriters will not exercise their option to purchase additional shares.
Mammoth Energy Services, Inc. was formed in June 2016, and has not and will not conduct any material business operations prior to the contribution described below other than certain activities related to the preparation of the registration statement for this offering. Mammoth Energy Services, Inc. is a wholly-owned subsidiary of Mammoth Energy Partners LP, which we refer to as Mammoth Partners. On November 24, 2014, Mammoth Energy Holdings LLC, or Mammoth Holdings (an affiliate of Wexford Capital LP, or Wexford), Gulfport Energy Corporation, or Gulfport, and Rhino Resource Partners LP, or Rhino, contributed to Mammoth Partners their respective interests in the following entities: Bison Drilling and Field Services LLC; Bison Trucking LLC; White Wing Tubular Services LLC; Barracuda Logistics LLC; Panther Drilling Systems LLC; Redback Energy Services LLC; Redback Coil Tubing LLC; Muskie Proppant LLC; Stingray Pressure Pumping LLC; Stingray Logistics LLC; and Great White Sand Tiger Lodging Ltd. Upon completion of these contributions, Mammoth Holdings, Gulfport and Rhino beneficially owned a 68.7%, 30.5% and 0.8% equity interest, respectively, in Mammoth Partners. Subsequently, Mammoth Partners formed Redback Pumpdown Services LLC, or Pumpdown, Mr. Inspections LLC, or Mr. Inspections, and Silverback Energy Services LLC, or Silverback, as wholly-owned subsidiaries. Immediately prior to the effectiveness of the registration statement of which this prospectus is a part, Mammoth Partners will convert to a Delaware limited liability company named Mammoth Energy Partners LLC, or Mammoth Partners LLC, and Mammoth Holdings, Gulfport and Rhino will contribute their respective interests in Mammoth Partners LLC to Mammoth Energy Services, Inc., and
ii
Mammoth Partners LLC will become its wholly-owned subsidiary. Except as expressly noted otherwise, the historical financial information of Mammoth Energy Services, Inc. included in this prospectus is derived from the consolidated financial statements of Mammoth Partners. The historical consolidated financial information of Mammoth Partners included in this prospectus is not indicative of the results that may be expected in any future periods.
iii
This summary contains basic information about us and the offering. Because it is a summary, it does not contain all the information that you should consider before investing in our common stock. You should read and carefully consider this entire prospectus before making an investment decision, especially the information presented under the heading “Risk Factors,” “Cautionary Note Regarding Forward-Looking Statements,” “Management’s Discussion and Analysis of Financial Condition and Results of Operations” and our consolidated financial statements and the accompanying notes included elsewhere in this prospectus.
Except as otherwise indicated or required by the context, all references in this prospectus to “Mammoth Energy,” the “Company,” “we,” “us” or “our,” and its assets and operations, relate to Mammoth Energy Services, Inc. and its consolidated subsidiaries after giving effect to the contribution contemplated immediately prior to the completion of this offering. References in this prospectus to “selling stockholders” refer to those entities identified as selling stockholders in “Principal and Selling Stockholders.” We have provided definitions for some of the oil and natural gas industry terms used in this prospectus in the “Glossary of Oil and Natural Gas Terms” included in this prospectus as Appendix A.
Except as otherwise indicated, all information contained in this prospectus assumes the underwriters do not exercise their option to purchase additional shares and excludes common stock reserved for issuance under our equity incentive plan.
Mammoth Energy Services, Inc.
Overview
We are an integrated, growth-oriented oilfield service company serving companies engaged in the exploration and development of North American onshore unconventional oil and natural gas reserves. Our primary business objective is to grow our operations and create value for stockholders through organic opportunities and accretive acquisitions. Our suite of services include completion and production services, natural sand proppant services, contract land and directional drilling services and remote accommodation services. Our completion and production services division provides pressure pumping services, pressure control services, flowback services and equipment rentals. Our natural sand proppant services division sells, distributes and is capable of producing proppant for hydraulic fracturing. Our contract land and directional drilling services division provides drilling rigs and crews for operators as well as rental equipment, such as mud motors and operational tools, for both vertical and horizontal drilling. Our remote accommodation services division provides housing, kitchen and dining, and recreational service facilities for oilfield workers located in remote areas away from readily available lodging. We believe that these services play a critical role in increasing the ultimate recovery and present value of production streams from unconventional resources. Our complementary suite of drilling and completion and production related services provides us with the opportunity to cross-sell our services and expand our customer base and geographic positioning.
Our Services
Completion and Production Services
Our primary service offering is providing pressure pumping services, also known as hydraulic fracturing, to exploration and production companies. These services are intended to optimize hydrocarbon flow paths during the completion phase of horizontal shale wellbores. We began providing pressure pumping services in October 2012 with 14 high pressure fracturing units capable of delivering a total of 28,000 horsepower. As of August 1, 2016, we had grown our pressure pumping business to three fleets consisting of an aggregate 64 high pressure fracturing units capable of delivering a total of 128,000 horsepower. These units allow us to execute multi-stage
1
hydraulic fracture stimulation on unconventional wells, which enhances production. Currently, we provide pressure pumping services in the Utica Shale of Eastern Ohio and in the Marcellus Shale in Pennsylvania. Two of our fleets, which are currently providing services in the Utica Shale, operate under a long-term contract expiring in September 2018.
Our pressure control services consist of coiled tubing, nitrogen and fluid pumping services. Our pressure control services equipment is designed to support drilling activities in unconventional resource plays with the ability to operate under high pressures without having to delay or cease production during completion operations. Ceasing or suppressing production during the completion phase of an unconventional well could result in formation damage impacting the overall recovery of reserves. Our pressure control services help operators minimize the risk of such damage during completion activities. As of August 1, 2016, our pressure control services were provided through our fleet of six coiled tubing units, four nitrogen pumping units, five fluid pumping units and various well control assets. We provide our pressure control services in the Eagle Ford Shale in South Texas and the Permian Basin in West Texas.
Our flowback services consist of production testing, solids control, hydrostatic testing and torque services. Flowback involves the process of allowing fluids to flow from the well following treatment, either in preparation for an impending phase of treatment or to return the well to production. Our flowback equipment consists of manifolds, accumulators, valves, flare stacks and other associated equipment that combine to form up to a total of five well-testing spreads. We provide flowback services in the Appalachian Basin, Haynesville Shale and mid-continent markets.
Our equipment rental services provide a wide range of oilfield related rental equipment used in flowback and hydraulic fracturing services. We provide equipment rental services in the Appalachian Basin and mid-continent markets.
Natural Sand Proppant Services
In our natural sand proppant business, we currently buy processed sand from suppliers on the spot market and resell that sand. We also have the ability to purchase raw sand under a fixed-price contract with one supplier, process it into premium monocrystalline sand (also known as frac sand), a specialized mineral that is used as a proppant, at our indoor sand processing plant located in Pierce County, Wisconsin and sell it to our customers for use in their hydraulic fracturing operations to enhance recovery rates from unconventional wells. Our sand processing plant is capable of producing a range of frac sand sizes for use in all major North American shale basins. Our supply of Jordan substrate exhibits the physical properties necessary to withstand the completion and production environments of the wells in these shale basins. Although our indoor processing plant is designed for year-round continuous wet and dry plant operation capable of producing a wide variety of frac sand products based on the needs of our customers, this plant is not currently producing sand as a result of the decline in commodity pricing and the resulting decrease in completion activity. Subject to market conditions and other factors, we currently anticipate returning this plant to operation, with minimal capital expenditures, as early as the fourth quarter of 2017. We also provide logistics solutions to facilitate delivery of our frac sand products to our customers. Almost all of our frac sand products are shipped by rail to our customers in the Utica Shale and Montney Shale in British Columbia and Alberta, Canada. Our access to origin and destination transloading facilities on multiple railways allow us to provide predictable and efficient loading, shipping and delivery of our frac sand products.
Contract Land and Directional Drilling Services
We provide vertical, horizontal and directional drilling services to our customers. We also provide related services such as rig moving and pipe inspection. As of August 1, 2016, we owned 13 land drilling rigs, ranging
2
from 800 to 1,500 horsepower, nine of which are specifically designed for drilling horizontal wells. Horizontal wells are increasing as a percentage of total wells drilled in North America and are frequently utilized in unconventional resource plays. Our drilling rigs have rated maximum depth capabilities ranging from 12,500 feet to 20,000 feet. Currently, we perform our contract land drilling services in the Permian Basin of West Texas.
Our directional drilling services provide for the efficient drilling and production of oil and natural gas from unconventional resource plays. These services allow operators to drill in non-vertical directions, including horizontally. Our directional drilling equipment includes mud motors used to propel drill bits and kits for measurement while drilling, or MWD, and electromagnetic, or EM, technology, which uses electromagnetic waves to highlight oil and natural gas deposits. MWD kits are down-hole tools that provide real-time measurements of the location and orientation of the bottom-hole assembly, which is necessary to adjust the drilling process and guide the wellbore to a specific target. This technology, coupled with our complementary services, allows our customers to drill wellbores to specific objectives within narrow location parameters within target horizons.
Our personnel are involved in all aspects of a well from the initial planning of a customer’s drilling program to the management and execution of the horizontal or directional drilling operation. As of August 1, 2016, we owned seven MWD kits and three EM kits used in vertical, horizontal and directional drilling applications, 52 mud motors, ten air motors and an inventory of related parts and equipment. Currently, we perform our directional drilling services in the Appalachian Basin, Anadarko Basin, Arkoma Basin and Permian Basin.
Remote Accommodation Services
Our remote accommodation business provides a turnkey solution for our customers’ accommodation needs. These modular camps, when assembled together, form large dormitories with kitchen and dining facilities and recreation areas. Currently, we provide remote accommodation services in the Canadian oil sands in Alberta, Canada. As of August 1, 2016, we had a capacity of 1,008 rooms, 880 of which are at Sand Tiger Lodge, our camp in northern Alberta, Canada, and 128 of which are available to be leased as rental equipment to a third party.
Our Strengths
Our primary business objective is to grow our operations and create value for our stockholders through growth opportunities and accretive acquisitions. We believe that the following strengths position us well to capitalize on activity in unconventional resource plays and achieve our primary business objective:
| • | Modern fleet of equipment designed for horizontal wells. Our service fleet is predominantly comprised of equipment designed to optimize recovery from unconventional wells. As of August 1, 2016, approximately 72% of our high pressure fracturing units had been purpose built within the last three years. Our pressure control equipment has been designed by us and has an average age of approximately three years. Our accommodation units have an average age of approximately five years and are built on a customer-by-customer basis to meet their specific needs. We believe that our modern fleet of quality equipment will allow us to provide a high level of service to our customers and capitalize on future growth in the unconventional resource plays that we serve. |
| • | Strategic geographic positioning, including primary presence in the Utica Shale and the Permian Basin. We currently operate facilities and service centers to support our operations in major unconventional resource plays in the United States, including the Utica Shale in Eastern Ohio, the Permian Basin in West Texas, the Marcellus Shale in Pennsylvania, the Granite Wash in Oklahoma |
3
| and Texas, the Cana Woodford Shale and the Cleveland Sand in Oklahoma, the Eagle Ford Shale in South Texas and the oil sands in Alberta, Canada. We believe our geographic positioning within active oil and natural gas liquids resource plays will benefit us strategically as activity increases in these unconventional resource plays. |
| • | Long-term contractual and other basin-level relationships with a stable customer base. We are party to a long-term contract with Gulfport to provide pressure pumping services and natural sand proppant services through September 2018. In addition, our operational division heads and field managers have formed long-term relationships with our customer base. We believe these contractual and other relationships help provide us a more stable and growth-oriented client base in the unconventional shale markets that we currently serve. Our customers include large independent oil and natural gas exploration and production companies. Our top five customers for the year ended December 31, 2015, representing 71% of our revenue, were Gulfport, EQT Production Company, Japan Canada Oil Sands Limited, referred to as Oil Sands Limited, RSP Permian LLC and Bantrel Co. Our top five customers for the six months ended June 30, 2016, representing 80% of our revenue, were Gulfport, Rice Energy Inc., Oil Sands Limited, Hilcorp Energy Company and Taylor Frac LLC. |
| • | Experienced management and operating team. Our operational division heads have an extensive track record in the oilfield services business with an average of over 34 years of oilfield services experience. In addition, our field managers have expertise in the geological basins in which they operate and understand the regional challenges that our customers face. We believe their knowledge of our industry and business lines enhances our ability to provide innovative, client-focused and basin-specific customer service, which we also believe strengthens our relationships with our customers. |
Our Business Strategy
We intend to achieve our primary business objective by the successful execution of our business plan to strategically deploy our equipment and personnel to provide completion and production services, natural sand proppant, drilling and remote accommodation services in unconventional resource plays, including the Utica Shale in Ohio and the Permian Basin in West Texas. We believe these services optimize our customers’ ultimate resources recovery and present value of hydrocarbon reserves. We seek to create cost efficiencies for our customers by providing a suite of complementary oilfield services designed to address a wide range of our customers’ needs. Specifically, we intend to create value for our stockholders through the following strategies:
| • | Capitalize on the recovery in activity in the unconventional resource plays. Our equipment is designed to provide a broad range of services for unconventional wells, and our operations are strategically located in major unconventional resource plays. During the first six months of 2016, the posted price for West Texas intermediate light sweet crude oil, which we refer to as West Texas Intermediate or WTI, rose from a low of $26.19 per barrel on February 11, 2016 to a high of $51.23 per barrel on June 8, 2016. During August 2016, WTI prices ranged from $39.50 to $48.48 per barrel. As commodity prices began to recover, we experienced an increase in activity. If near term commodity prices stabilize at current levels and recover further, we expect to experience further increase in demand for our services and products. We intend to capitalize on the anticipated increase in activity in these markets and diversify our operations across additional unconventional resource basins. Our core operations are currently focused in the Utica Shale in Ohio and the Permian Basin in West Texas. We intend to continue to strategically deploy assets to these and other unconventional resource basins and will look to capitalize on further growth in emerging unconventional resource plays as they develop. |
4
| • | Leverage our broad range of services for unconventional wells for cross-selling opportunities. We offer a complementary suite of oilfield services and products. Our completion and production division provides pressure pumping services, pressure control services and flowback services for unconventional wells. Our natural sand proppant services division sells and produces proppant for hydraulic fracturing. Our drilling services division adds drilling capabilities to our other well-related services. We intend to leverage our existing customer relationships and operational track record to cross sell our services and increase our exposure and product offerings to our existing customers, broaden our customer base and expand opportunistically to other geographic regions in which our customers have operations, as well as to create operational efficiencies for our customers. |
| • | Expand through selected, accretive acquisitions. To complement our organic growth, we intend to actively pursue selected, accretive acquisitions of businesses and assets, primarily related to our completion and production services and natural sand proppant services, that can meet our targeted returns on invested capital and enhance our portfolio of products and services, market positioning and/or geographic presence. We believe this strategy will facilitate the continued expansion of our customer base, geographic presence and service offerings. We also believe that our industry contacts and those of Wexford, our equity sponsor and largest stockholder, will facilitate the identification of acquisition opportunities. We expect to use our common stock as consideration for accretive acquisitions. |
| • | Maintain a conservative balance sheet. We seek to maintain a conservative balance sheet, which allows us to better react to changes in commodity prices and related demand for our services, as well as overall market conditions. We expect to repay all outstanding borrowings under our revolving credit facility with a portion of the net proceeds from this offering and will have no outstanding debt immediately after this offering. |
| • | Expand our services to meet expanding customer demand. The scope of services for horizontal wells is greater than that for conventional wells. Industry analysts have reported that the average horsepower, length of lateral and number of fracture stages has continued to increase since 2008. We consistently monitor market conditions and intend to expand the capacity and scope of our business lines as demand warrants in resource plays in which we currently operate, as well as in new resource plays. If we perceive unmet demand in our principal geographic locations for different service lines, we will seek to expand our current service offerings to meet that demand. |
| • | Leverage our experienced operational management team and basin-level expertise. We seek to manage the services we provide as closely as possible to the needs of our customer base. Our operational division heads have long-term relationships with our largest customers. We intend to leverage these relationships and our operational management team’s basin-level expertise to deliver innovative, client focused and basin-specific services to our customers. |
Risk Factors
Investing in our common stock involves risks. You should read carefully the section of this prospectus entitled “Risk Factors” beginning on page 16 for an explanation of these risks before investing in our common stock. In particular, the following considerations may offset our competitive strengths or have a negative effect on our strategy or operating activities, which could cause a decrease in the price of our common stock and a loss of all or part of your investment.
Risks Related to Our Business
| • | The volatility of oil and natural gas prices due to factors beyond our control greatly affects our profitability. |
| • | Intense competition within our lines of business may adversely affect our ability to market our services. |
5
| • | A decrease in demand for our products or services may have a material adverse effect on our financial condition and results of operations. |
| • | As part of our natural sand proppant business, we rely on a limited number of third parties for raw materials and transportation, and the termination of our relationship with one or more of these third parties could adversely affect our operations. |
| • | We provide the majority of our hydraulic fracturing and natural sand proppant services to Gulfport pursuant to contracts that expire in September 2018. The loss of or reduction in this relationship could adversely affect our financial condition and results of operations. |
| • | Our operations are subject to various governmental regulations which require compliance that can be burdensome and expensive. |
| • | Any failure by us to comply with applicable environmental laws and regulations, including those relating to hydraulic fracturing, could result in governmental authorities taking actions, including curtailment or suspension of our services that could adversely affect our operations and financial condition. |
| • | Our operations are subject to operational hazards for which we may not be adequately insured. |
| • | Approximately 80.6% of our remote accommodation services during the first six months of 2016 were attributable to Oil Sands Limited. We expect that our current services for this customer will decrease by at least 70% in the fourth quarter of 2016 after it completes the construction phase of its project, which is expected to occur in October 2016. Our failure to replace the revenue received from this customer will have a material adverse effect on the financial results of our remote accommodation services division and could have a material adverse effect on our consolidated results of operations and financial condition. |
| • | Our remote accommodation services are provided in Canada on tribal lands. Our failure to maintain favorable relationships with these tribes could adversely affect our operations and financial results. |
| • | Our failure to successfully identify, complete and integrate future acquisitions of properties or businesses could reduce our revenue and slow our growth. |
| • | Our major stockholders, Wexford and Gulfport, may have conflicts of interest with us, and they may favor their own interests to the detriment of us and our stockholders. |
| • | Wexford and Gulfport may compete with us. |
Our Equity Sponsor
Mammoth Partners was formed by Wexford, a Greenwich, Connecticut based Securities and Exchange Commission, or SEC, registered investment advisor with approximately $2.7 billion under management as of June 30, 2016 and particular experience in the energy and natural resources sector.
Prior to the closing of this offering, we will enter into an advisory services agreement with Wexford under which Wexford will provide us with financial and strategic advisory services related to our business. For further information regarding this agreement, an investor rights agreement with Gulfport and certain other agreements we are also party to with Wexford and its affiliates, please see “Management” and “Certain Relationships and Related Party Transactions.”
6
Our History and the Contribution
Mammoth Energy Services, Inc. was formed in June 2016 and has not and will not conduct any material business operations prior to the contribution described below other than certain activities related to the preparation of the registration statement for this offering. Mammoth Energy Services, Inc. is a wholly-owned subsidiary of Mammoth Partners. On November 24, 2014, Mammoth Holdings, Gulfport and Rhino contributed to Mammoth Partners their respective interests in the following entities: Bison Drilling and Field Services, LLC, or Bison Drilling; Bison Trucking LLC, or Bison Trucking; White Wing Tubular Services LLC, or White Wing; Barracuda Logistics LLC, or Barracuda; Panther Drilling Systems LLC, or Panther Drilling; Redback Energy Services, LLC, or Redback Energy Services; Redback Coil Tubing, LLC, or Redback Coil Tubing; Muskie Proppant LLC, or Muskie Proppant; Stingray Pressure Pumping LLC, or Pressure Pumping; Stingray Logistics LLC, or Logistics; and Great White Sand Tiger Lodging Ltd., or Sand Tiger. Upon completion of these contributions, Mammoth Holdings, Gulfport and Rhino beneficially owned a 68.7%, 30.5% and 0.8% equity interest, respectively, in Mammoth Partners. Subsequently, Mammoth Partners formed Redback Pumpdown Services LLC, or Pumpdown, Mr. Inspections LLC, or Mr. Inspections, and Silverback Energy Services LLC, or Silverback, as wholly-owned subsidiaries. Immediately prior to the effectiveness of the registration statement of which this prospectus is a part, Mammoth Partners will convert to a Delaware limited liability company named Mammoth Energy Partners LLC, or Mammoth Partners LLC, and Mammoth Holdings, Gulfport and Rhino will contribute their respective interests in Mammoth Partners LLC to Mammoth Energy Services, Inc., and Mammoth Partners LLC will become its wholly-owned subsidiary. Except as expressly noted otherwise, the historical financial information of Mammoth Energy Services, Inc. included in this prospectus is derived from the consolidated financial statements of Mammoth Partners. The historical consolidated financial information of Mammoth Partners included in this prospectus is not indicative of the results that may be expected in any future periods. For more information, please see “—Summary Consolidated Historical and Pro Forma Financial Data” and related notes thereto included elsewhere in this prospectus.
The following organizational charts illustrate (a) our pre-offering organizational structure and (b) our organizational structure after giving effect to the offering:
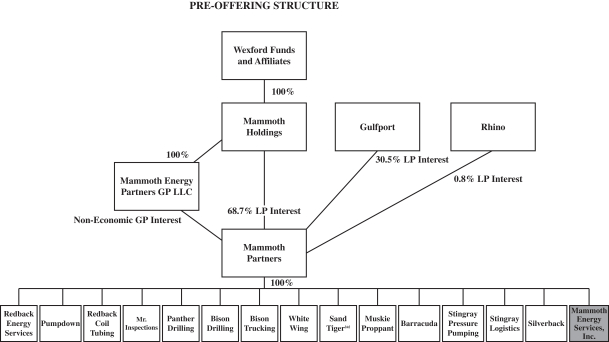
(a) Our 100% interest in Sand Tiger is indirectly held through our wholly-owned subsidiary, Sand Tiger Holdings Inc. Through this holding company, Sand Tiger is treated as a corporation for U.S. federal income tax purposes and is subject to Canadian income taxes.
7
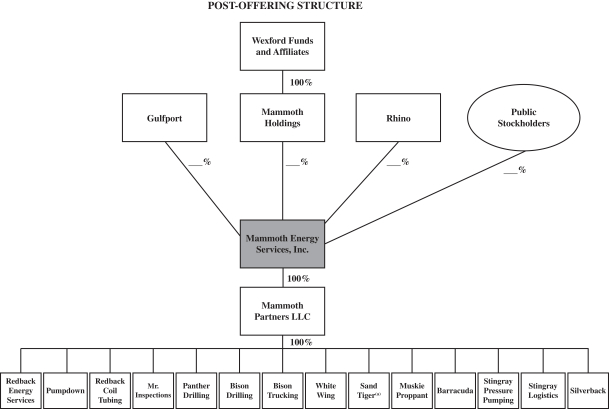
| (a) | Our 100% interest in Sand Tiger is indirectly held through our wholly-owned subsidiary, Sand Tiger Holdings Inc. Through this holding company, Sand Tiger is treated as a corporation for U.S. federal income tax purposes and is subject to Canadian income taxes. |
Emerging Growth Company
We are an “emerging growth company” within the meaning of the federal securities laws. For as long as we are an emerging growth company, we will not be required to comply with certain requirements that are applicable to other public companies that are not “emerging growth companies” including, but not limited to, not being required to comply with the auditor attestation requirements of Section 404 of the Sarbanes-Oxley Act and the reduced disclosure obligations regarding executive compensation in our periodic reports. We intend to take advantage of these reporting exemptions until we are no longer an emerging growth company. For a description of the qualifications and other requirements applicable to emerging growth companies and certain elections that we have made due to our status as an emerging growth company, see “Risk Factors—Risks Inherent to this Offering and Our Common Stock—For so long as we are an ‘emerging growth company’ we will not be required to comply with certain disclosure requirements that are applicable to other public companies and we cannot be certain if the reduced disclosure requirements applicable to emerging growth companies will make our common stock less attractive to investors” on page 38 of this prospectus.
Our Offices
Our principal executive offices are located at 4727 Gaillardia Parkway, Suite 200, Oklahoma City, OK 73142, and our telephone number at that address is (405) 608-6007. Our website address is www.mammothenergy.com Information contained on our website does not constitute part of this prospectus.
8
The Offering
| Common stock offered by us |
shares ( shares if the underwriters’ option to purchase additional shares is exercised in full) |
| Common stock offered by the selling stockholders |
shares ( shares if the underwriters’ option to purchase additional shares is exercised in full) |
| Common stock to be outstanding immediately after completion of this offering |
shares ( shares if the underwriters’ option to purchase additional shares is exercised in full) |
| Use of proceeds |
We intend to use the net proceeds of this offering to repay outstanding borrowings in the amount of $ million under our revolving credit facility and for general corporate purposes, which may include the acquisition of additional equipment and complementary businesses. We will not receive any proceeds from the sale of shares by the selling stockholders. See “Use of Proceeds.” |
| Dividend policy |
We currently anticipate that we will retain all future earnings, if any, to finance the growth and development of our business. We do not intend to pay cash dividends in the foreseeable future. |
| Listing symbol |
We have applied for listing of our shares of common stock on The NASDAQ Global Market under the symbol “TUSK.” |
| Directed Share Program |
At our request, the underwriters have reserved up to % of the common stock being offered by this prospectus for sale to our directors, executive officers, employees, business associates and related persons at the public offering price. The sales will be made by the underwriters through a directed share program. We do not know if these persons will choose to purchase all or any portion of this reserved common stock, but any purchases they do make will reduce the number of shares available to the general public. To the extent the allotted shares are not purchased in the directed share program, we will offer these shares to the public. These persons must commit to purchase no later than the close of business on the day following the date of this prospectus. Any directors or executive officers purchasing such reserved common stock will be prohibited from selling such stock for a period of 180 days after the date of this prospectus. |
| Risk Factors |
You should carefully read and consider the information beginning on page 16 of this prospectus set forth under the heading “Risk Factors” and all other information set forth in this prospectus before deciding to invest in our common stock. |
9
Except as otherwise indicated, all information contained in this prospectus:
| • | Assumes the underwriters do not exercise their option to purchase additional shares; and |
| • | Excludes shares of common stock reserved for issuance under our equity incentive plan. |
10
Summary Consolidated Historical and Pro Forma Financial Data
The following table sets forth our summary consolidated historical and pro forma financial data as of and for each of the periods indicated. The summary consolidated historical financial data as of December 31, 2015 and 2014 and for the years ended December 31, 2015 and 2014 are derived from the historical audited consolidated financial statements of Mammoth Partners included elsewhere in this prospectus. The summary consolidated historical financial data for the six months ended June 30, 2016 and 2015 are derived from the historical unaudited consolidated financial statements of Mammoth Partners included elsewhere in this prospectus. The selected consolidated historical balance sheet data as of June 30, 2015 are derived from the unaudited consolidated balance sheet of Mammoth Partners and its consolidated subsidiaries as of such date, which is not included in this prospectus. The unaudited pro forma C Corporation financial data presented give effect to income taxes assuming we operated as a taxable corporation since January 1, 2014. Operating results for the years ended December 31, 2015 and 2014 and the six months ended June 30, 2016 and 2015 are not necessarily indicative of results that may be expected for any future periods. You should review this information together with “Management’s Discussion and Analysis of Financial Condition and Results of Operations,” “Selected Historical Consolidated Financial Data” and the historical consolidated financial statements and related notes of Mammoth Partners included elsewhere in this prospectus.
| Historical (1) | ||||||||||||||||
| Six Months Ended (1) June 30, |
Year Ended (1) December 31, |
|||||||||||||||
| 2016 | 2015 | 2015 | 2014 | |||||||||||||
| Statement of Operations Data (2): |
||||||||||||||||
| Revenue: |
||||||||||||||||
| Services revenue |
$ | 46,887,094 | $ | 111,672,225 | $ | 172,012,405 | $ | 182,341,309 | ||||||||
| Services revenue – related parties |
40,714,870 | 73,305,163 | 132,674,989 | 30,834,421 | ||||||||||||
| Product revenue |
2,155,807 | 13,373,845 | 16,732,077 | 36,859,731 | ||||||||||||
| Product revenue – related parties |
13,688,020 | 21,584,555 | 38,517,222 | 9,490,543 | ||||||||||||
|
|
|
|
|
|
|
|
|
|||||||||
| Total revenue |
103,445,791 | 219,935,788 | 359,936,693 | 259,526,004 | ||||||||||||
|
|
|
|
|
|
|
|
|
|||||||||
| Cost and expenses (3): |
||||||||||||||||
| Services cost of revenue (exclusive of depreciation and amortization) |
66,264,807 | 132,085,648 | 225,820,450 | 150,482,793 | ||||||||||||
| Services cost of revenue (exclusive of depreciation and amortization) – related parties |
4,551,718 | 3,042,931 | 4,177,335 | 1,770,565 | ||||||||||||
| Product cost of revenue (exclusive of depreciation and amortization) |
3,939,766 | 18,632,060 | 25,838,555 | 35,525,596 | ||||||||||||
| Product cost of revenue (exclusive of depreciation and amortization) – related parties |
9,516,307 | 12,102,723 | 20,510,977 | 3,289,947 | ||||||||||||
|
|
|
|
|
|
|
|
|
|||||||||
| Total cost of revenue |
84,272,598 | 165,863,362 | 276,347,317 | 191,068,901 | ||||||||||||
|
|
|
|
|
|
|
|
|
|||||||||
| Selling, general and administrative (exclusive of depreciation and amortization) |
7,664,158 | 9,402,890 | 19,303,557 | 14,272,986 | ||||||||||||
| Selling, general and administrative (exclusive of depreciation and amortization) – related parties |
386,637 | 447,691 | 1,237,991 | 2,754,877 | ||||||||||||
|
|
|
|
|
|
|
|
|
|||||||||
| Total selling, general and administrative |
8,050,795 | 9,850,581 | 20,541,548 | 17,027,863 | ||||||||||||
| Depreciation and amortization |
35,667,383 | 35,736,832 | 72,393,882 | 35,627,165 | ||||||||||||
| Impairment of long-lived assets |
1,870,885 | 4,470,781 | 12,124,353 | — | ||||||||||||
|
|
|
|
|
|
|
|
|
|||||||||
| Total cost and expenses |
129,861,661 | 215,921,556 | 381,407,100 | 243,723,929 | ||||||||||||
|
|
|
|
|
|
|
|
|
|||||||||
| Operating (loss) income |
(26,415,870) | 4,014,232 | (21,470,407) | 15,802,075 | ||||||||||||
11
| Historical (1) | ||||||||||||||||
| Six Months Ended (1) June 30, |
Year Ended (1) December 31, |
|||||||||||||||
| 2016 | 2015 | 2015 | 2014 | |||||||||||||
| Other Income (Expense): |
||||||||||||||||
| Interest income |
— | 98,242 | 98,492 | 214,141 | ||||||||||||
| Interest expense |
(2,109,205) | (2,806,330) | (5,290,821) | (4,603,595) | ||||||||||||
| Interest expense – related parties |
— | — | — | (184,479) | ||||||||||||
| Other, net |
694,690 | (2,092,485) | (2,157,764) | (5,724,496) | ||||||||||||
|
|
|
|
|
|
|
|
|
|||||||||
| Total other expense |
(1,414,515) | (4,800,573) | (7,350,093) | (10,298,429) | ||||||||||||
|
|
|
|
|
|
|
|
|
|||||||||
| (Loss) income before income taxes |
(27,830,385) | (786,341) | (28,820,500) | 5,503,646 | ||||||||||||
| Provision (benefit) for income taxes |
1,683,735 | 1,573,136 | (1,589,086) | 7,514,194 | ||||||||||||
|
|
|
|
|
|
|
|
|
|||||||||
| Net loss |
$ | (29,514,120) | $ | (2,359,477) | $ | (27,231,414) | $ | (2,010,548) | ||||||||
|
|
|
|
|
|
|
|
|
|||||||||
| Other Comprehensive (Loss) Income: |
||||||||||||||||
| Foreign currency translation adjustment, net of tax of $0 for the six months ended June 30, 2016 and 2015 and $0 and $298,170 for the years ended December 31, 2015 and 2014, respectively |
1,969,858 | (1,617,441 | ) | (4,814,819 | ) | 472,714 | ||||||||||
|
|
|
|
|
|
|
|
|
|||||||||
| Comprehensive loss |
$ | (27,544,262 | ) | $ | (3,976,918 | ) | $ | (32,046,233 | ) | $ | (1,537,834 | ) | ||||
|
|
|
|
|
|
|
|
|
|||||||||
| Pro Forma C Corporation Data (1): |
||||||||||||||||
| Historical (loss) income before income taxes |
$ | (27,830,385 | ) | $ | (786,341 | ) | $ | (28,820,500 | ) | $ | 5,503,646 | |||||
| Pro forma (benefit) provision for income taxes |
(3,287,051 | ) | (3,431,215 | ) | (4,058,116 | ) | 12,721,822 | |||||||||
|
|
|
|
|
|
|
|
|
|||||||||
| Pro forma net (loss) income |
$ | (24,543,334 | ) | $ | 2,644,874 | $ | (24,762,384 | ) | $ | (7,218,176 | ) | |||||
|
|
|
|
|
|
|
|
|
|||||||||
| Pro forma (loss) income per common share—basic and diluted |
$ | $ | 0.09 | $ | $ | (0.34 | ) | |||||||||
|
|
|
|
|
|
|
|
|
|||||||||
| Weighted average pro forma shares outstanding—basic and diluted (4) |
30,000,000 | 21,056,073 | ||||||||||||||
|
|
|
|
|
|
|
|
|
|||||||||
| Other Financial Data: |
||||||||||||||||
| Adjusted EBITDA(5) |
$ | 11,122,398 | $ | 44,221,845 | $ | 63,047,828 | $ | 55,268,082 | ||||||||
|
|
|
|
|
|
|
|
|
|||||||||
| Cash flows provided by operating activities |
$ | 11,842,981 | $ | 43,911,916 | $ | 68,392,616 | $ | 8,247,714 | ||||||||
|
|
|
|
|
|
|
|
|
|||||||||
| Purchases of property and equipment |
$ | (2,548,958 | ) | $ | (20,574,047 | ) | $ | (26,251,675 | ) | $ | (111,690,056 | ) | ||||
| Other investing activities, net |
3,165,516 | 320,273 | 1,416,766 | 10,125,141 | ||||||||||||
|
|
|
|
|
|
|
|
|
|||||||||
| Cash flows provided by (used in) investing activities |
$ | 616,558 | $ | (20,253,774 | ) | $ | (24,834,909 | ) | $ | (101,564,915 | ) | |||||
|
|
|
|
|
|
|
|
|
|||||||||
| Capital contributions (distributions) |
$ | — | $ | — | $ | (711 | ) | $ | 51,768,502 | |||||||
| Proceeds from financing arrangements, net of repayments |
(14,602,516 | ) | (28,648,742 | ) | (55,930,761 | ) | 51,369,550 | |||||||||
| Other financing activities, net |
— | — | — | (12,301 | ) | |||||||||||
|
|
|
|
|
|
|
|
|
|||||||||
| Cash flows (used in) provided by financing activities |
$ | (14,602,516 | ) | $ | (28,648,742 | ) | $ | (55,931,472 | ) | $ | 103,125,751 | |||||
|
|
|
|
|
|
|
|
|
|||||||||
12
| Historical (1) | ||||||||||||||||
| As of June 30, | As of December 31, | |||||||||||||||
| 2016 | 2015 | 2015 | 2014 | |||||||||||||
| Balance sheet data: |
||||||||||||||||
| Current Assets: |
||||||||||||||||
| Cash and cash equivalents |
$ | 938,068 | $ | 10,872,354 | $ | 3,074,072 | $ | 15,674,492 | ||||||||
| Accounts receivable, net |
19,318,282 | 33,373,885 | 17,797,852 | 49,002,910 | ||||||||||||
| Receivables from related parties |
33,933,501 | 40,847,841 | 25,643,781 | 35,142,962 | ||||||||||||
| Inventories |
4,476,480 | 4,956,168 | 4,755,661 | 4,220,401 | ||||||||||||
| Prepaid expenses |
4,979,878 | 4,631,900 | 4,447,253 | 9,171,113 | ||||||||||||
| Other current assets |
581,788 | 618,809 | 422,219 | 1,002,011 | ||||||||||||
|
|
|
|
|
|
|
|
|
|||||||||
| Total current assets |
64,227,997 | 95,300,957 | 56,140,838 | 114,213,889 | ||||||||||||
| Property, plant and equipment, net |
241,104,996 | 312,159,842 | 273,026,665 | 334,150,453 | ||||||||||||
| Intangible assets, net – customer relationships |
20,129,772 | 28,753,439 | 24,309,772 | 32,956,971 | ||||||||||||
| Intangible assets, net – trade names |
5,972,557 | 6,683,557 | 6,328,057 | 7,038,900 | ||||||||||||
| Goodwill |
86,043,148 | 86,131,395 | 86,043,148 | 86,131,395 | ||||||||||||
| Other non-current assets |
5,537,684 | 5,318,094 | 5,137,090 | 6,223,268 | ||||||||||||
|
|
|
|
|
|
|
|
|
|||||||||
| Total assets |
$ | 423,016,154 | $ | 534,347,284 | $ | 450,985,570 | $ | 580,714,876 | ||||||||
|
|
|
|
|
|
|
|
|
|||||||||
| Liabilities: |
||||||||||||||||
| Current liabilities |
$ | 43,127,062 | $ | 55,500,169 | $ | 30,790,175 | $ | 71,108,086 | ||||||||
| Long-term debt |
82,300,000 | 120,000,000 | 95,000,000 | 146,041,013 | ||||||||||||
| Deferred income taxes |
1,596,577 | 6,807,993 | 1,460,959 | 7,476,580 | ||||||||||||
| Other liabilities |
373,515 | 806,545 | 571,174 | 878,991 | ||||||||||||
|
|
|
|
|
|
|
|
|
|||||||||
| Total liabilities |
127,397,154 | 183,114,707 | 127,822,308 | 225,504,670 | ||||||||||||
|
|
|
|
|
|
|
|
|
|||||||||
| Total unitholders’ equity |
295,619,000 | 351,232,577 | 323,163,262 | 355,210,206 | ||||||||||||
|
|
|
|
|
|
|
|
|
|||||||||
| Total liabilities and unitholders’ equity |
$ | 423,016,154 | $ | 534,347,284 | $ | 450,985,570 | $ | 580,714,876 | ||||||||
|
|
|
|
|
|
|
|
|
|||||||||
| (1) | Mammoth Energy Services, Inc. was formed in June 2016, and has not and will not conduct any material business operations prior to the contribution described below other than certain activities related to the preparation of the registration statement for this offering. Mammoth Energy Services, Inc. is a wholly-owned subsidiary of Mammoth Partners. Except as expressly noted otherwise, the historical financial information of Mammoth Energy Services, Inc. included in this prospectus is derived from the consolidated financial statements of Mammoth Partners. Mammoth Partners was treated as a partnership for federal income tax purposes during the periods presented. As a result, essentially all of the taxable earnings and losses of Mammoth Partners were passed through to its limited partners, and Mammoth Partners did not pay federal income taxes at the entity level. Immediately prior to the effectiveness of the registration statement of which this prospectus is a part, Mammoth Partners will convert to a Delaware limited liability company named Mammoth Energy Partners LLC, and Mammoth Holdings, Gulfport and Rhino will contribute their respective interests in Mammoth Partners LLC to Mammoth Energy Services, Inc., and Mammoth Partners LLC will become its wholly-owned subsidiary. In connection with the contribution, all of the subsidiaries of Mammoth Partners will become subsidiaries of Mammoth Energy Services, Inc. and, because we will be a subchapter C corporation under the Internal Revenue Code of 1986, as amended, or the Code, all of our subsidiaries’ earning will become subject to federal income tax. For comparative purposes, we have included a pro forma financial data for the historical periods to give effect to income taxes assuming the earnings of these entities had been subject to federal income tax as a subchapter C corporation since inception. The unaudited pro forma data is presented for informational purposes only, and does not purport to project our results of operations for any future period or our financial position as of any future date. |
13
| (2) | Related party revenue, costs and expenses are those that we paid to or received from one or more affiliated parties. |
| (3) | See pages F-4 and F-33 for depreciation and amortization amounts excluded by line item and by period. |
| (4) | Unaudited pro forma basic and diluted income (loss) per share will be presented for the latest fiscal year and interim period on the basis of the aggregate number of shares to be issued in connection with the contribution, upon determination of the number of those shares. |
| (5) | Adjusted EBITDA is a supplemental non-GAAP financial measure that is used by management and external users of our financial statements, such as industry analysts, investors, lenders and rating agencies. We define Adjusted EBITDA as earnings before interest expense, provision for income taxes, depreciation and amortization expense, impairment of long-lived assets, equity based compensation and other non-operating income or expense, net (which is comprised of the (gain) or loss on disposal of long-lived assets, as well as charges associated with Mammoth Partner’s proposed public offering in 2014). We exclude the items listed above from net income in arriving at Adjusted EBITDA because these amounts can vary substantially from company to company within our industry depending upon accounting methods and book values of assets, capital structures and the method by which the assets were acquired. Adjusted EBITDA should not be considered as an alternative to, or more meaningful than, net income (loss) or cash flows from operating activities as determined in accordance with GAAP or as an indicator of our operating performance or liquidity. Certain items excluded from Adjusted EBITDA are significant components in understanding and assessing a company’s financial performance, such as a company’s cost of capital and tax structure, as well as the historic costs of depreciable assets, none of which are components of Adjusted EBITDA. Our computations of Adjusted EBITDA may not be comparable to other similarly titled measure of other companies. We believe that Adjusted EBITDA is a widely followed measure of operating performance and may also be used by investors to measure our ability to meet debt service requirements. |
The following tables present a reconciliation of the non-GAAP financial measure of Adjusted EBITDA to the GAAP financial measure of net income (loss).
| Historical (1) | ||||||||||||||||
| Six Months Ended June 30, |
Year Ended December 31, |
|||||||||||||||
| 2016 | 2015 | 2015 | 2014 | |||||||||||||
| Reconciliation of Adjusted EBITDA to net loss: |
||||||||||||||||
| Net loss |
$ | (29,514,120) | $ | (2,359,477) | $ | (27,231,414) | $ | (2,010,548) | ||||||||
| Depreciation and amortization expense |
35,667,383 | 35,736,832 | 72,393,882 | 35,627,165 | ||||||||||||
| Impairment of long-lived assets |
1,870,885 | 4,470,781 | 12,124,353 | — | ||||||||||||
| Equity based compensation |
— | — | — | 3,838,842 | ||||||||||||
| Interest income |
— | (98,242) | (98,492) | (214,141) | ||||||||||||
| Interest expense |
2,109,205 | 2,806,330 | 5,290,821 | 4,788,074 | ||||||||||||
| Other non-operating (income) expense, net |
(694,690) | 2,092,485 | 2,157,764 | 5,724,496 | ||||||||||||
| Provision (benefit) for income taxes |
1,683,735 | 1,573,136 | (1,589,086) | 7,514,194 | ||||||||||||
|
|
|
|
|
|
|
|
|
|||||||||
| Adjusted EBITDA |
$ | 11,122,398 | $ | 44,221,845 | $ | 63,047,828 | $ | 55,268,082 | ||||||||
|
|
|
|
|
|
|
|
|
|||||||||
14
An investment in our common stock involves a high degree of risk. You should carefully consider the following risks and all of the other information contained in this prospectus before deciding to invest in our common stock. Our business, financial condition and results of operations could be materially and adversely affected by any of these risks. The risks described below are not the only ones facing us. Additional risks not presently known to us or which we currently consider immaterial also may adversely affect us.
Risks Related to Our Business and the Oil and Natural Gas Industry
Our business depends on the oil and natural gas industry and particularly on the level of exploration and production activity within the United States and Canada, and the ongoing decline in prices for oil and natural gas have had, and continue to have, an adverse effect on our revenue, cash flows, profitability and growth.
Demand for most of our products and services depends substantially on the level of expenditures by companies in the oil and natural gas industry. The significant decline in oil and natural gas prices during 2015 has continued during the first part of 2016. The low commodity price environment has caused a reduction in the drilling, completion and other production activities of most of our customers and their spending on our products and services. Although the prices for oil have recently improved, this overall trend with respect to our customers’ activities and spending has continued in 2016. The reduction in demand from our customers has resulted in an oversupply of many of the services and products we provide, and such oversupply has substantially reduced the prices we can charge our customers for our services, particularly customers of our well site services segment. These conditions generally worsened throughout 2015 and, if oil and natural gas prices remain depressed or further decline, this further reduction in our customers’ activity levels and spending, and reductions in the prices we charge, could continue and accelerate through the remainder of 2016 and beyond. In addition, a continuation or worsening of these conditions may result in a material adverse impact on certain of our customers’ liquidity and financial position resulting in further spending reductions, delays in the collection of amounts owing to us and similar impacts. These conditions have had and may continue to have an adverse impact on our financial condition, results of operations and cash flows, and it is difficult to predict how long the current low commodity price environment will continue.
Many factors over which we have no control affect the supply of and demand for, and our customers’ willingness to explore, develop and produce oil and natural gas, and therefore, influence prices for our products and services, including:
| • | the domestic and foreign supply of and demand for oil and natural gas; |
| • | the level of prices, and expectations about future prices, of oil and natural gas; |
| • | the level of global oil and natural gas exploration and production; |
| • | the cost of exploring for, developing, producing and delivering oil and natural gas; |
| • | the expected decline rates of current production; |
| • | the price and quantity of foreign imports; |
| • | political and economic conditions in oil producing countries, including the Middle East, Africa, South America and Russia; |
| • | the ability of members of the Organization of Petroleum Exporting Countries to agree to and maintain oil price and production controls; |
| • | speculative trading in crude oil and natural gas derivative contracts; |
15
| • | the level of consumer product demand; |
| • | the discovery rates of new oil and natural gas reserves; |
| • | contractions in the credit market; |
| • | the strength or weakness of the U.S. dollar; |
| • | available pipeline and other transportation capacity; |
| • | the levels of oil and natural gas storage; |
| • | weather conditions and other natural disasters; |
| • | political instability in oil and natural gas producing countries; |
| • | domestic and foreign tax policy; |
| • | domestic and foreign governmental approvals and regulatory requirements and conditions; |
| • | the continued threat of terrorism and the impact of military and other action, including military action in the Middle East; |
| • | technical advances affecting energy consumption; |
| • | the proximity and capacity of oil and natural gas pipelines and other transportation facilities; |
| • | the price and availability of alternative fuels; |
| • | the ability of oil and natural gas producers to raise equity capital and debt financing; |
| • | merger and divestiture activity among oil and natural gas producers; and |
| • | overall domestic and global economic conditions. |
These factors and the volatility of the energy markets make it extremely difficult to predict future oil and natural gas price movements with any certainty. Any of the above factors could impact the level of oil and natural gas exploration and production activity and could ultimately have a material adverse effect on our business, financial condition, results of operations and cash flows. Further, should the low commodity price environment continue or worsen, we could encounter difficulties such as an inability to access needed capital on attractive terms or at all, the incurrence of asset impairment charges, an inability to meet financial ratios contained in our debt agreements, a need to reduce our capital spending and other similar impacts.
The cyclicality of the oil and natural gas industry may cause our operating results to fluctuate.
We derive our revenues from companies in the oil and natural gas exploration and production industry, a historically cyclical industry with levels of activity that are significantly affected by the levels and volatility of oil and natural gas prices. We have, and may in the future, experience significant fluctuations in operating results as a result of the reactions of our customers to changes in oil and natural gas prices. For example, prolonged low commodity prices experienced by the oil and natural gas industry during 2015 and 2016, combined with adverse changes in the capital and credit markets, caused many exploration and production companies to reduce their capital budgets and drilling activity. This resulted in a significant decline in demand for oilfield services and adversely impacted the prices oilfield services companies could charge for their services. In addition, a majority of the service revenue we earn is based upon a charge for a relatively short period of time (e.g., an hour, a day, a week) for the actual period of time the service is provided to our customers. By contracting services on a short-term basis, we are exposed to the risks of a rapid reduction in market prices and utilization, with resulting volatility in our revenues.
16
If oil prices or natural gas prices remain low or decline further, the demand for our services could be adversely affected.
The demand for our services is primarily determined by current and anticipated oil and natural gas prices and the related general production spending and level of drilling activity in the areas in which we have operations. Volatility or weakness in oil prices or natural gas prices (or the perception that oil prices or natural gas prices will decrease) affects the spending patterns of our customers and may result in the drilling of fewer new wells or lower production spending on existing wells. This, in turn, could result in lower demand for our services and may cause lower rates and lower utilization of our well service equipment. If oil prices decline or natural gas prices continue to remain low or decline further, or if there is a reduction in drilling activities, the demand for our services and our results of operations could be materially and adversely affected.
Prices for oil and natural gas historically have been extremely volatile and are expected to continue to be volatile. During the past six years, the posted WTI price for oil has ranged from a low of $26.19 per barrel, or Bbl, in February 2016 to a high of $113.39 per Bbl in April 2011. The Henry Hub spot market price of natural gas has ranged from a low of $1.49 per MMBtu in March 2016 to a high of $7.51 per MMBtu in January 2010. During 2015, WTI prices ranged from $36.48 to $65.69 per Bbl and the Henry Hub spot market price of natural gas ranged from $1.80 to $3.65 per MMBtu. On February 11, 2016, the WTI posted price for crude oil was $26.19 per Bbl and the Henry Hub spot market price of natural gas was $2.15 per MMBtu, representing decreases of 60% and 41%, respectively, from the high of $65.69 per Bbl of oil and $3.65 per MMBtu for natural gas during 2015. If the prices of oil and natural gas continue at current levels or decline further, our operations, financial condition and level of expenditures may be materially and adversely affected.
Our business is difficult to evaluate because we have a limited operating history.
Mammoth Energy Services, Inc. was formed in June 2016, and has not and will not conduct any material business operations prior to the contribution other than certain activities related to the preparation of the registration statement for this offering. Mammoth Energy Services, Inc. is a wholly-owned subsidiary of Mammoth Partners, which was originally formed in February 2014. Except as expressly noted otherwise, the historical financial information of Mammoth Energy Services, Inc. and operational data described in this prospectus is that of Mammoth Partners and its consolidated subsidiaries. These subsidiaries were formed or acquired between 2007 and 2015. As a result, there is only limited historical financial and operating information available upon which to base your evaluation of our performance.
Our customer base is concentrated and the loss of one or more of our significant customers, or their failure to pay the amounts they owe us, could cause our revenue to decline substantially.
Our top five customers accounted for approximately 80% and 71% of our revenue for the six months ended June 30, 2016 and the year ended December 31, 2015, respectively. Gulfport was our largest customer accounting for approximately 49% and 47% of our revenue for such periods. During the six months ended June 30, 2016, Rice Energy accounted for 12% of our revenue and Oil Sands Limited accounted for 11% of our revenue. For the year ended December 31, 2015, EQT Production Company accounted for 12% of our revenue. It is likely that we will continue to derive a significant portion of our revenue from a relatively small number of customers in the future. If a major customer decided not to continue to use our services, our revenue would decline and our operating results and financial condition could be harmed. For example, effective January 1, 2016, we entered into an amendment to our master services agreement with Gulfport in which Gulfport suspended its use of our hydraulic fracturing services during the first quarter of 2016. As a result, there were no revenues attributable to these services from Gulfport during the first quarter of 2016 as compared to $25.8 million for the fourth quarter of 2015 and approximately $124.4 million during the year ended December 31, 2015. Under the amendment, the services that were suspended during the first quarter, and the related fees, are to be performed and paid for during the second and third quarters of 2016. We recognized revenues of $38.2 million
17
from Gulfport for these services during the second quarter of 2016. In addition, we are subject to credit risk due to the concentration of our customer base. Any nonperformance by our counterparties, including their failure to pay the amounts they owe us, either as a result of changes in financial and economic conditions or otherwise, could have an adverse impact on our operating results and could adversely affect our liquidity.
We provide the majority of our hydraulic fracturing completion services to Gulfport, and the termination of this relationships could adversely affect our operations.
We provide completion services, which services include hydraulic fracturing. The majority of our revenue from this business is derived from Gulfport pursuant to a contract that expires in September 2018. We cannot assure you that we will be able to extend or renew our contracts with Gulfport on favorable terms and conditions or at all. Likewise, we cannot assure you that we would be able to obtain replacement long-term contracts with other customers sufficient to continue providing the level of services as we currently do with Gulfport. The termination of our relationships or nonrenewal of our agreement with Gulfport could have a material adverse effect on our business, financial condition, results of operations and cash flows.
We provide natural sand proppant to a limited number of customers, and the termination of one or more of these relationships could adversely affect our operations.
We provide natural sand proppant used for hydraulic fracturing. The majority of our revenue from this business is derived from Gulfport pursuant to a contract that expires in September 2018. The termination of our relationship or nonrenewal of our agreement with Gulfport, or one or more of our other customers, could have a material adverse effect on our business, financial condition, results of operations and cash flows.
We provide our remote accommodations services to a limited number of customers, and the termination of one or more of these or other relationships could adversely affect our operations.
We provide turnkey remote accommodations services for oilfield related labor located in remote areas, which services include site identification, permitting and development, facility design, construction, installation and full site maintenance. Approximately 80.6% of remote accommodation services during the first six months of 2016 were attributable to Oil Sands Limited. We anticipate that Oil Sands Limited’s occupancy of our accommodations will decrease by at least 70% in the fourth quarter of 2016 following the completion of the construction phase of its project in the service area, which is currently estimated to occur in October 2016. During the second quarter of 2016, our revenue from this customer was $5.7 million, or 86.4% of our remote accommodation revenues during that period. Our failure to replace the revenue received from this customer will have a material adverse effect on the financial results of our remote accommodation services division and could have a material adverse effect on our consolidated results of operations and financial condition. The termination of our relationship with any other of our remote accommodation customers could also have a material adverse effect on this part of our business. Further, our remote accommodation services are provided in Canada on tribal lands. Our failure to maintain favorable relationships with these tribes could adversely affect our operations and financial results.
The current low commodity price environment has negatively impacted oil and natural gas exploration and production companies and, in some cases, impaired their ability to timely pay for products or services provided or resulted in their insolvency or bankruptcy, any of which exposes us to credit risk of our oil and natural gas exploration and production customers.
In weak economic and commodity price environments, we may experience increased difficulties, delays or failures in collecting outstanding receivables from our customers, due to, among other reasons, a reduction in their cash flow from operations, their inability to access the credit markets and, in certain cases, their insolvencies. Such increases in collection issues could have a material adverse effect on our business, results of operations, cash flows and financial condition. We cannot assure you that the reserves we have established for
18
potential credit losses will be sufficient to meet write-offs of uncollectible receivables or that our losses from such receivables will be consistent with our expectations.
To the extent one or more of our key customers commences bankruptcy proceedings, our contracts with these customers may be subject to rejection under applicable provisions of the United States Bankruptcy Code, or may be renegotiated. Further, during any such bankruptcy proceeding, prior to assumption, rejection or renegotiation of such contracts, the bankruptcy court may temporarily authorize the payment of value for our services less than contractually required, which could also have a material adverse effect on our business, results of operations, cash flows and financial condition.
Competition within the oilfield services industry may adversely affect our ability to market our services.
The oilfield services industry is highly competitive and fragmented and includes numerous small companies capable of competing effectively in our markets on a local basis, as well as several large companies that possess substantially greater financial and other resources than we do. Our larger competitors’ greater resources could allow those competitors to compete more effectively than we can. The amount of equipment available may exceed demand, which could result in active price competition. Many contracts are awarded on a bid basis, which may further increase competition based primarily on price. In addition, adverse market conditions lower demand for well servicing equipment, which results in excess equipment and lower utilization rates. If market conditions in our oil-oriented operating areas were to deteriorate or if adverse market conditions in our natural gas-oriented operating areas persist, utilization rates may decline.
Shortages, delays in delivery and interruptions in supply of drill pipe, replacement parts, other equipment, supplies and materials may adversely affect our contract land and directional drilling business.
During periods of increased demand for drilling services, the industry has experienced shortages of drill pipe, replacement parts, other equipment, supplies and materials, including, in the case of our pressure pumping operations, proppants, acid, gel and water. These shortages can cause the price of these items to increase significantly and require that orders for the items be placed well in advance of expected use. In addition, any interruption in supply could result in significant delays in delivery of equipment and materials or prevent operations. Interruptions may be caused by, among other reasons:
| • | weather issues, whether short-term such as a hurricane, or long-term such as a drought, and |
| • | shortage in the number of vendors able or willing to provide the necessary equipment, supplies and materials, including as a result of commitments of vendors to other customers or third parties. |
These price increases, delays in delivery and interruptions in supply may require us to increase capital and repair expenditures and incur higher operating costs. Severe shortages, delays in delivery and interruptions in supply could limit our ability to construct and operate our drilling rigs and could have a material adverse effect on our business, financial condition, cash flows and results of operations.
Rig upgrade, refurbishment and new rig construction projects, as well as the reactivation of rigs that have been idle for six months or longer, are subject to risks which could cause delays or cost overruns and adversely affect our cash flows, results of operations and financial position.
New drilling rigs or rigs being upgraded, converted or re-activated following a period of stack may experience start-up complications and may encounter other operational problems that could result in significant delays, uncompensated downtime, reduced dayrates or the cancellation, termination or non-renewal of drilling contracts. Rig construction and upgrade projects are subject to risks of delay or significant cost overruns inherent in any large construction project from numerous factors, including the following:
| • | shortages of equipment, materials or skilled labor; |
19
| • | unscheduled delays in the delivery of ordered materials and equipment or shipyard construction; |
| • | failure of equipment to meet quality and/or performance standards; |
| • | financial or operating difficulties of equipment vendors; |
| • | unanticipated actual or purported change orders; |
| • | inability by us or our customer to obtain required permits or approvals, or to meet applicable regulatory standards in our areas of operations; |
| • | unanticipated cost increases between order and delivery; |
| • | adverse weather conditions and other events of force majeure; |
| • | design or engineering changes; and |
| • | work stoppages and other labor disputes. |
The occurrence of any of these events could have a material adverse effect on our cash flows, results of operations and financial position.
Advancements in drilling and well service technologies could have a material adverse effect on our business, financial condition, results of operations and cash flows.
The oilfield services industry is characterized by rapid and significant technological advancements and introductions of new products and services using new technologies. As new horizontal and directional drilling, pressure pumping, pressure control and other well service technologies develop, we may be placed at a competitive disadvantage, and competitive pressure may force us to implement new technologies at a substantial cost. We may not be able to successfully acquire or use new technologies.
Further, our customers are increasingly demanding the services of newer, higher specification drilling rigs.
There can be no assurance that we will:
| • | have sufficient capital resources to build new, technologically advanced drilling rigs; |
| • | successfully integrate additional drilling rigs; |
| • | effectively manage the growth and increased size of our organization and drilling fleet; |
| • | successfully deploy idle, stacked or additional drilling rigs; |
| • | maintain crews necessary to operate additional drilling rigs; or |
| • | successfully improve our financial condition, results of operations, business or prospects as a result of building new drilling rigs. |
If we are not successful in building new rigs and equipment or upgrading our existing rigs and equipment in a timely and cost-effective manner, we could lose market share. New technologies, services or standards could render some of our services, drilling rigs or equipment obsolete, which could have a material adverse impact on our business, financial condition and results of operation.
20
Our business depends upon our ability to obtain specialized equipment and parts from third-party suppliers, and we may be vulnerable to delayed deliveries and future price increases.
We purchase specialized equipment and parts from third party suppliers and affiliates, including companies controlled by Wexford. At times during the business cycle, there is a high demand for hydraulic fracturing, coiled tubing and other oil field services and extended lead times to obtain equipment needed to provide these services. Further, there are a limited number of suppliers that manufacture the equipment we use. Should our current suppliers be unable or unwilling to provide the necessary equipment and parts or otherwise fail to deliver the products timely and in the quantities required, any resulting delays in the provision of our services could have a material adverse effect on our business, financial condition, results of operations and cash flows. In addition, future price increases for this type of equipment and parts could negatively impact our ability to purchase new equipment to update or expand our existing fleet or to timely repair equipment in our existing fleet.
As part of our proppant sales and distribution business, we rely on third parties for raw materials and transportation, and the termination of our relationship with one or more of these third parties could adversely affect our operations.
As part of our proppant sales and distribution business, we buy processed sand from suppliers on the spot market and resell that sand. Although we are not doing so at this time, we also have the ability to buy raw sand, process it into premium monocrystalline sand, a specialized mineral that is used as a proppant (also known as frac sand), at our indoor sand processing plant located in Pierce County, Wisconsin and sell it to our customers for use in their hydraulic fracturing operations to enhance the recovery rates of hydrocarbons from oil and natural gas wells. We also provide logistics solutions to deliver our frac sand products to our customers. Because our customers generally find it impractical to store frac sand in large quantities near their job sites, they seek to arrange for product to be delivered where and as needed, which requires predictable and efficient loading and shipping of product. To facilitate our logistics capabilities, we contract with third party providers to transport our frac sand products to railroad facilities for delivery to our customers. We also lease a railcar fleet from various third parties to deliver our frac sand products to our customers and lease or otherwise utilize origin and destination transloading facilities. The termination or nonrenewal of our relationship with any one or more of these third parties involved in the sourcing, transportation and delivery of our frac sand products could result in material operational delays, increase our operating costs, limit our ability to service our customers’ wells or otherwise materially and adversely affect our business and operating results.
Future performance of our proppant sales and distribution business will depend on our ability to succeed in competitive markets, and on our ability to appropriately react to potential fluctuations in the demand for and supply of frac sand.
In our proppant sales and distribution business, we operate in a highly competitive market that is characterized by a small number of large, national producers and a larger number of small, regional or local producers. Competition in the industry is based on price, consistency and quality of product, site location, distribution and logistics capabilities, customer service, reliability of supply and breadth of product offering. The large, national producers with whom we compete include Badger Mining Corporation, Fairmount Santrol Holdings, Inc., Hi-Crush Partners LP, Preferred Proppants LLC, Unimin Corporation and U.S. Silica Holdings Inc. Our larger competitors may have greater financial and other resources than we do, may develop technology superior to ours, may have production facilities that are located closer to sand mines from which raw sand is mined or to their key customers than our processing facility or have a more cost effective access to raw sand and transportation facilities that we do. Should the demand for hydraulic fracturing services decrease, prices in the frac sand market could materially decrease as producers may seek to preserve market share or exit the market and sell frac sand at below market prices. In addition, oil and natural gas exploration and production companies and other providers of hydraulic fracturing services could acquire their own frac sand reserves, develop or expand frac sand production capacity or otherwise fulfill their own proppant requirements and existing or new frac sand producers could add to or expand their frac sand production capacity, which may negatively impact pricing and
21
demand for our frac sand. We may not be able to compete successfully against either our larger or smaller competitors in the future, and competition could have a material adverse effect on our business, financial condition, results of operations and cash flows.
An increase in the supply of raw frac sand having similar characteristics as the raw frac sand we sell or have the ability to produce could make it more difficult for us to market our sand on favorable terms or at all.
We have entered into a take-or-pay contract with our principal frac sand supplier. If significant new reserves of raw frac sand continue to be discovered and developed, and those frac sands have similar characteristics to the frac sand we produce, the market price for our frac sand may decline. If the market price for our frac sand falls below an amount equal to the contracted purchase price in our take-or-pay contract plus our processing and related transportation costs, this could have an adverse effect on our results of operations and cash flows over the remaining term of this contract.
Diminished access to water and inability to secure or maintain necessary permits may adversely affect operations of our frac sand processing plant when such operations are restarted.
The processing of raw sand and production of natural sand proppant require significant amounts of water. As a result, securing water rights and water access is necessary to operate our processing facilities. If the area where our facilities are located experiences water shortages, restrictions or any other constraints due to drought, contamination or otherwise, there may be additional costs associated with securing water access. Although we have obtained water rights to service our activities when we are ready to restart operations at our processing plant, the amount of water that we are entitled to use pursuant to our water rights must be determined by the appropriate regulatory authorities. Such regulatory authorities may amend the regulations regarding such water rights, increase the cost of maintaining such water rights or eliminate our current water rights, and we may be unable to retain all or a portion of such water rights. If implemented, these new regulations could also affect local municipalities and other industrial operations and could have a material adverse effect on costs involved in operating our processing plant. Such changes in laws, regulations or government policy and related interpretations pertaining to water rights may alter the environment in which we do business, which may have an adverse effect on our financial condition and results of operations. Additionally, a water discharge permit may be required to properly dispose of water at our processing site when in operation. Certain of our facilities are also required to obtain storm water permits. The water discharge, storm water or any other permits we may be required to have in order to conduct our frac sand processing operations (when they are restarted) is subject to regulatory discretion, and any inability to obtain or maintain the necessary permits could have an adverse effect on our ability to run such operations.
Demand for our frac sand products could be reduced by changes in well stimulation processes and technologies, as well as changes in governmental regulations and other applicable law.
As part of our proppant sales and production business, we sell custom frac sand products to our customers for use in their hydraulic fracturing operations to enhance the recovery rates of hydrocarbons from oil and natural gas wells. A significant shift in demand from frac sand to other proppants, or the development of new processes to replace hydraulic fracturing altogether, could cause a decline in the demand for the frac sand we produce and result in a material adverse effect on our financial condition and results of operations. Further, federal and state governments and agencies have adopted various laws and regulations or are evaluating proposed legislation and regulations that are focused on the extraction of shale gas or oil using hydraulic fracturing, a process which utilizes proppants such as those that we produce. Future hydraulic fracturing-related legislation or regulations could restrict the ability of our customers to utilize, or increase the cost associated with, hydraulic fracturing, which could reduce demand for our proppants and adversely affect our financial condition, results of operations and cash flows. For additional information regarding the regulation of hydraulic fracturing, see “—Risks Related to Our Business and the Oil and Natural Gas Industry—Federal and state legislative and regulatory initiatives relating to hydraulic fracturing could result in increased costs and additional operating restrictions or delays.”
22
The customized nature, and remote location, of the modular camps that we provide and service present unique challenges that could adversely affect our ability to successfully operate our remote accommodations business.
We rely on a third-party subcontractor to manufacture and install the customized modular units used in our remote accommodations business. These customized units often take a considerable amount of time to manufacture and, once manufactured, often need to be delivered to remote areas that are frequently difficult to access by traditional means of transportation. In the event we are unable to provide these modular units in a timely fashion, we may not be entitled to full, or any, payment therefor under the terms of our contracts with customers. In addition, the remote location of the modular camps often makes it difficult to install and maintain the units, and our failure, on a timely basis, to have such units installed and provide maintenance services could result in our breach of, and non-payment by our customers under, the terms of our customer contracts. Any of these factors could have a material adverse effect on our remote accommodation business and our overall financial condition and results of operations.
Health and food safety issues and food-borne illness concerns could adversely affect our remote accommodations business.
We provide food services to our customers as part of our remote accommodations business and, as a result, face health and food safety issues that are common in the food and hospitality industries. Food-borne illnesses, such as E. coli, hepatitis A, trichinosis or salmonella, and food safety issues have occurred in the food industry in the past and could occur in the future. Our reliance on third-party food suppliers and distributors increases the risk that food-borne illness incidents could be caused by factors outside of our control. New illnesses resistant to any precautions may develop in the future, or diseases with long incubation periods could arise. Further, the remote nature of our accommodation facilities and related food services may increase the risk of contamination of our food supply and create additional health and hygiene concerns due to the limited access to modern amenities and conveniences that may not be faced by other food service providers or hospitality businesses operating in urban environment. If our customers become ill from food-borne illness, we could be forced to close some or all of our remote accommodation facilities on a temporary basis or otherwise. Any such incidents and/or any report of publicity linking us to incidents of food-borne illness or other food safety issues, including food tampering or contamination, could adversely affect our remote accommodations business as well as our overall financial condition and results of operations.
Development of permanent infrastructure in the Canadian oil sands region or other locations where we locate our remote accommodations could negatively impact our remote accommodations business.
Our remote accommodations business specializes in providing modular housing and related services for work forces in remote areas which lack the infrastructure typically available in towns and cities. If permanent towns, cities and municipal infrastructure develop in the oil sands region of northern Alberta, Canada or other regions where we locate our modular camps, then demand for our accommodations could decrease as customer employees move to the region and choose to utilize permanent housing and food services.
Revenue generated and expenses incurred by our remote accommodation business are denominated in the Canadian dollar and could be negatively impacted by currency fluctuations.
Our remote accommodation business generates revenue and incurs expenses that are denominated in the Canadian dollar. These transactions could be materially affected by currency fluctuations. Changes in currency exchange rates could adversely affect our combined results of operations or financial position. We also maintain cash balances denominated in the Canadian dollar. At December 31, 2015, we had $1.9 million of cash in Canadian accounts. A 10% increase in the strength of the Canadian dollar versus the U.S. dollar would have resulted in an increase in pre-tax income of approximately $1.1 million as of December 31, 2015. Conversely, a corresponding decrease in the strength of the Canadian dollar would have resulted in a comparable decrease in pre-tax income. We have not hedged our exposure to changes in foreign currency exchange rates and, as a result, could incur unanticipated translation gains and losses.
23
Certain of our completion and production services, particularly our hydraulic fracturing, are substantially dependent on the availability of water. Restrictions on our ability to obtain water may have an adverse effect on our financial condition, results of operations and cash flows.
Water is an essential component of deep shale oil and natural gas production during both the drilling and hydraulic fracturing processes. Over the past several years, certain of the areas have experienced extreme drought conditions and competition for water in such shales is growing. As a result of this severe drought, some local water districts have begun restricting the use of water subject to their jurisdiction for hydraulic fracturing to protect local water supply. Our inability to obtain water to use in our operations from local sources or to effectively utilize flowback water could have an adverse effect on our financial condition, results of operations and cash flows.
We rely on a few key employees whose absence or loss could adversely affect our business.
Many key responsibilities within our business have been assigned to a small number of employees. The loss of their services could adversely affect our business. In particular, the loss of the services of one or more members of our executive team, including our Chairman, Chief Executive Officer and Chief Financial Officer, could disrupt our operations. We do not have any written employment agreement with our executives at this time. Further, we do not maintain “key person” life insurance policies on any of our employees. As a result, we are not insured against any losses resulting from the death of our key employees.
If we are unable to employ a sufficient number of skilled and qualified workers, our capacity and profitability could be diminished and our growth potential could be impaired.
The delivery of our products and services requires skilled and qualified workers with specialized skills and experience who can perform physically demanding work. As a result of the volatility of the oilfield services industry and the demanding nature of the work, workers may choose to pursue employment in fields that offer a more desirable work environment at wage rates that are competitive. Our ability to be productive and profitable will depend upon our ability to employ and retain skilled workers. In addition, our ability to expand our operations depends in part on our ability to increase the size of our skilled labor force. The demand for skilled workers is high, and the supply is limited. As a result, competition for experienced oilfield service personnel is intense, and we face significant challenges in competing for crews and management with large and well-established competitors. A significant increase in the wages paid by competing employers could result in a reduction of our skilled labor force, increases in the wage rates that we must pay, or both. If either of these events were to occur, our capacity and profitability could be diminished and our growth potential could be impaired.
Unionization efforts could increase our costs or limit our flexibility.
Presently, none of our employees work under collective bargaining agreements. Unionization efforts have been made from time to time within our industry, to varying degrees of success. Any such unionization could increase our costs or limit our flexibility.
Our operations may be limited or disrupted in certain parts of the continental U.S. and Canada during severe weather conditions, which could have a material adverse effect on our financial condition and results of operations.
We provide contract land and directional drilling services and completion and production services in the Utica, Permian Basin, Marcellus, Granite Wash, Cana Woodford and Eagle Ford resource plays located in the continental U.S. We also provide remote accommodation services in the oil sands in Alberta, Canada. We serve these markets through our facilities and service centers located in Ohio, Oklahoma, Texas, Wisconsin, Minnesota and Alberta, Canada. For the six months ended June 30, 2016 and the year ended December 31, 2015, we
24
generated approximately 85% and 72%, respectively, of our revenue from our operations in Ohio, Wisconsin, Minnesota, Pennsylvania, West Virginia and Canada where weather conditions may be severe, particularly during winter and spring months. Repercussions of severe weather conditions may include:
| • | curtailment of services; |
| • | weather-related damage to equipment resulting in suspension of operations; |
| • | weather-related damage to our facilities; |
| • | inability to deliver equipment and materials to jobsites in accordance with contract schedules; and |
| • | loss of productivity. |
Many municipalities, including those in Ohio and Wisconsin, impose bans or other restrictions on the use of roads and highways, which include weight restrictions on the paved roads that lead to our jobsites due to the muddy conditions caused by spring thaws. This can limit our access to these jobsites and our ability to service wells in these areas. These constraints and the resulting shortages or high costs could delay our operations and materially increase our operating and capital costs in those regions. Weather conditions may also affect the price of crude oil and natural gas, and related demand for our services. Any of these factors could have a material adverse effect on our financial condition and results of operations.
Concerns over general economic, business or industry conditions may have a material adverse effect on our results of operations, liquidity and financial condition.
Concerns over global economic conditions, energy costs, geopolitical issues, inflation, the availability and cost of credit and the European, Asian and the United States financial markets have contributed to increased economic uncertainty and diminished expectations for the global economy. These factors, combined with volatility in commodity prices, business and consumer confidence and unemployment rates, have precipitated an economic slowdown. Concerns about global economic growth have had a significant adverse impact on global financial markets and commodity prices. If the economic climate in the United States or abroad deteriorates, worldwide demand for petroleum products could diminish further, which could impact the price at which oil, natural gas and natural gas liquids can be sold, which could affect the ability of our customers to continue operations and ultimately adversely impact our results of operations, liquidity and financial condition.
A terrorist attack or armed conflict could harm our business
The occurrence or threat of terrorist attacks in the United States or other countries, anti-terrorist efforts and other armed conflicts involving the United States or other countries, including continued hostilities in the Middle East, may adversely affect the United States and global economies and could prevent us from meeting our financial and other obligations. If any of these events occur, the resulting political instability and societal disruption could reduce overall demand for oil and natural gas, potentially putting downward pressure on demand for our services and causing a reduction in our revenues. Oil and natural gas related facilities could be direct targets of terrorist attacks, and our operations could be adversely impacted if infrastructure integral to our customers’ operations is destroyed or damaged. Costs for insurance and other security may increase as a result of these threats, and some insurance coverage may become more difficult to obtain, if available at all.
Our operations require substantial capital and we may be unable to obtain needed capital or financing on satisfactory terms or at all, which could limit our ability to grow.
The oilfield services industry is capital intensive. In conducting our business and operations, we have made, and expect to continue to make, substantial capital expenditures. Our total capital expenditures were approximately
25
$26.3 million and $111.7 million for the year ended December 31, 2015 and the year ended December 31, 2014, respectively. Our capital expenditures budget for 2016 is approximately $3.7 million. Since November 2014, we have financed capital expenditures primarily with funding from cash on hand, cash generated by operations and borrowings under our revolving credit facility. Following the completion of this offering and the application of the net proceeds to repay our outstanding indebtedness under our revolving credit facility, we intend to finance our capital expenditures primarily with cash on hand, cash flow from operations and borrowings under our revolving credit facility. We may be unable to generate sufficient cash from operations and other capital resources to maintain planned or future levels of capital expenditures which, among other things, may prevent us from acquiring new equipment or properly maintaining our existing equipment. Further, any disruptions or continuing volatility in the global financial markets may lead to an increase in interest rates or a contraction in credit availability impacting our ability to finance our operations. This could put us at a competitive disadvantage or interfere with our growth plans. Further, our actual capital expenditures for 2016 or future years could exceed our capital expenditure budget. In the event our capital expenditure requirements at any time are greater than the amount we have available, we could be required to seek additional sources of capital, which may include debt financing, joint venture partnerships, sales of assets, offerings of debt or equity securities or other means. We may not be able to obtain any such alternative source of capital. We may be required to curtail or eliminate contemplated activities. If we can obtain alternative sources of capital, the terms of such alternative may not be favorable to us. In particular, the terms of any debt financing may include covenants that significantly restrict our operations. Our inability to grow as planned may reduce our chances of maintaining and improving profitability.
The growth of our business through acquisitions may expose us to various risks, including those relating to difficulties in identifying suitable, accretive acquisition opportunities and integrating businesses, assets and personnel, as well as difficulties in obtaining financing for targeted acquisitions and the potential for increased leverage or debt service requirements.
As a component of our business strategy, we have pursued and intend to continue to pursue selected, accretive acquisitions of complementary assets, businesses and technologies. Acquisitions involve numerous risks, including:
| • | unanticipated costs and assumption of liabilities and exposure to unforeseen liabilities of acquired businesses, including but not limited to environmental liabilities; |
| • | difficulties in integrating the operations and assets of the acquired business and the acquired personnel; |
| • | limitations on our ability to properly assess and maintain an effective internal control environment over an acquired business, in order to comply with public reporting requirements; |
| • | potential losses of key employees and customers of the acquired businesses; |
| • | inability to commercially develop acquired technologies; |
| • | risks of entering markets in which we have limited prior experience; and |
| • | increases in our expenses and working capital requirements. |
The process of integrating an acquired business may involve unforeseen costs and delays or other operational, technical and financial difficulties and may require a disproportionate amount of management attention and financial and other resources. Our failure to achieve consolidation savings, to incorporate the acquired businesses and assets into our existing operations successfully or to minimize any unforeseen operational difficulties could have a material adverse effect on our financial condition and results of operations. Furthermore, there is intense competition for acquisition opportunities in our industry. Competition for acquisitions may increase the cost of, or cause us to refrain from, completing acquisitions.
26
In addition, we may not have sufficient capital resources to complete additional acquisitions. Historically, we have financed capital expenditures primarily with funding from our equity investors, cash generated by operations and borrowings under our revolving credit facility. We may incur substantial indebtedness to finance future acquisitions and also may issue equity, debt or convertible securities in connection with such acquisitions. Debt service requirements could represent a significant burden on our results of operations and financial condition and the issuance of additional equity or convertible securities could be dilutive to our existing stockholders. Furthermore, we may not be able to obtain additional financing on satisfactory terms. Even if we have access to the necessary capital, we may be unable to continue to identify additional suitable acquisition opportunities, negotiate acceptable terms or successfully acquire identified targets.
Our ability to grow through acquisitions and manage growth will require us to continue to invest in operational, financial and management information systems and to attract, retain, motivate and effectively manage our employees. The inability to effectively manage the integration of acquisitions could reduce our focus on subsequent acquisitions and current operations, which, in turn, could negatively impact our earnings and growth. Our financial position and results of operations may fluctuate significantly from period to period, based on whether or not significant acquisitions are completed in particular periods.
We may have difficulty managing growth in our business, which could adversely affect our financial condition and results of operations.
As a recently formed company, growth in accordance with our business plan, if achieved, could place a significant strain on our financial, technical, operational and management resources. As we expand the scope of our activities and our geographic coverage through both organic growth and acquisitions, there will be additional demands on our financial, technical, operational and management resources. The failure to continue to upgrade our technical, administrative, operating and financial control systems or the occurrences of unexpected expansion difficulties, including the failure to recruit and retain experienced managers, engineers and other professionals in the oilfield services industry, could have a material adverse effect on our business, financial condition, results of operations and our ability to successfully or timely execute our business plan.
If our intended expansion of our business is not successful, our financial condition, profitability and results of operations could be adversely affected, and we may not achieve increases in revenue and profitability that we hope to realize.
A key element of our business strategy involves the expansion of our services, geographic presence and customer base. These aspects of our strategy are subject to numerous risks and uncertainties, including:
| • | an inability to retain or hire experienced crews and other personnel; |
| • | a lack of customer demand for the services we intend to provide; |
| • | an inability to secure necessary equipment, raw materials (particularly sand and other proppants) or technology to successfully execute our expansion plans; |
| • | shortages of water used in our hydraulic fracturing operations; |
| • | unanticipated delays that could limit or defer the provision of services by us and jeopardize our relationships with existing customers and adversely affect our ability to obtain new customers for such services; and |
| • | competition from new and existing services providers. |
27
Encountering any of these or any unforeseen problems in implementing our planned expansion could have a material adverse impact on our business, financial condition, results of operations and cash flows, and could prevent us from achieving the increases in revenues and profitability that we hope to realize.
Our indebtedness and liquidity needs could restrict our operations and make us more vulnerable to adverse economic conditions.
Our existing and future indebtedness, whether incurred in connection with acquisitions, operations or otherwise, may adversely affect our operations and limit our growth, and we may have difficulty making debt service payments on such indebtedness as payments become due. Our level of indebtedness may affect our operations in several ways, including the following:
| • | increasing our vulnerability to general adverse economic and industry conditions; |
| • | the covenants that are contained in the agreements governing our indebtedness could limit our ability to borrow funds, dispose of assets, pay dividends and make certain investments; |
| • | our debt covenants could also affect our flexibility in planning for, and reacting to, changes in the economy and in our industry; |
| • | any failure to comply with the financial or other covenants of our debt, including covenants that impose requirements to maintain certain financial ratios, could result in an event of default, which could result in some or all of our indebtedness becoming immediately due and payable; |
| • | our level of debt could impair our ability to obtain additional financing in the future for working capital, capital expenditures, acquisitions or other general corporate purposes; and |
| • | our business may not generate sufficient cash flow from operations to enable us to meet our obligations under our indebtedness. |
Our revolving credit facility imposes, and any of our future credit facilities may impose, restrictions on us that may affect our ability to successfully operate our business.
Our revolving credit facility limits, and any of our future credit facilities may limit, our ability to take various actions, such as:
| • | incurring additional indebtedness; |
| • | paying dividends; |
| • | creating certain additional liens on our assets; |
| • | entering into sale and leaseback transactions; |
| • | making investments; |
| • | entering into transactions with affiliates; |
| • | making material changes to the type of business we conduct or our business structure; |
| • | making guarantees; |
28
| • | entering into hedges; |
| • | disposing of assets in excess of certain permitted amounts; |
| • | merging or consolidating with other entities; and |
| • | selling all or substantially all of our assets. |
In addition, our revolving credit facility requires, and any future debt may require, us to maintain certain financial ratios and to satisfy certain financial conditions, which may require us to reduce our debt or take some other action in order to comply with each of them. These restrictions could also limit our ability to obtain future financings, make needed capital expenditures, withstand a downturn in our business or the economy in general, or otherwise conduct necessary corporate activities. We also may be prevented from taking advantage of business opportunities that arise because of the limitations imposed on us by the restrictive covenants under our revolving credit facility and any future debt agreements. If we fail to comply with the covenants in our existing revolving credit facility or any future debt agreements and such failure is not waived by the lender, a default may be declared by the lenders, which could have a material adverse effect on us.
Our revolving credit facility provides, and any future credit facilities may provide, for variable interest rates, which may increase or decrease our interest expense.
We had an aggregate of $82.3 million outstanding under our revolving credit facility at June 30, 2016, with a weighted average interest rate of 3.3%. A 1% increase or decrease in the interest rates would increase or decrease interest expense, respectively, by approximately $0.8 million per year. We do not currently hedge our interest rate exposure.
We may not be able to provide services that meet the specific needs of oil and natural gas exploration and production companies at competitive prices.
The markets in which we operate are generally highly competitive and have relatively few barriers to entry. The principal competitive factors in our markets are price, product and service quality and availability, responsiveness, experience, technology, equipment quality and reputation for safety. We compete with large national and multi-national companies that have longer operating histories, greater financial, technical and other resources and greater name recognition than we do. Several of our competitors provide a broader array of services and have a stronger presence in more geographic markets. In addition, we compete with several smaller companies capable of competing effectively on a regional or local basis. Our competitors may be able to respond more quickly to new or emerging technologies and services and changes in customer requirements. Some contracts are awarded on a bid basis, which further increases competition based on price. Pricing is often the primary factor in determining which qualified contractor is awarded a job. The competitive environment may be further intensified by mergers and acquisitions among oil and natural gas companies or other events that have the effect of reducing the number of available customers. As a result of competition, we may lose market share or be unable to maintain or increase prices for our present services or to acquire additional business opportunities, which could have a material adverse effect on our business, financial condition, results of operations and cash flows.
In addition, some exploration and production companies have begun performing hydraulic fracturing and directional drilling on their wells using their own equipment and personnel. Any increase in the development and utilization of in-house fracturing and directional drilling capabilities by our customers could decrease the demand for our services and have a material adverse impact on our business.
29
Our operations are subject to hazards inherent in the oil and natural gas industry, which could expose us to substantial liability and cause us to lose customers and substantial revenue.
Risks inherent to our industry, such as equipment defects, vehicle accidents, fires, explosions, blowouts, surface cratering, uncontrollable flows of gas or well fluids, pipe or pipeline failures, abnormally pressured formations and various environmental hazards such as oil spills and releases of, and exposure to, hazardous substances. For example, our operations are subject to risks associated with hydraulic fracturing, including any mishandling, surface spillage or potential underground migration of fracturing fluids, including chemical additives. The occurrence of any of these events could result in substantial losses to us due to injury or loss of life, severe damage to or destruction of property, natural resources and equipment, pollution or other environmental damage, clean-up responsibilities, regulatory investigations and penalties, suspension of operations and repairs required to resume operations. The cost of managing such risks may be significant. The frequency and severity of such incidents will affect operating costs, insurability and relationships with customers, employees and regulators. In particular, our customers may elect not to purchase our services if they view our environmental or safety record as unacceptable, which could cause us to lose customers and substantial revenues. In addition, these risks may be greater for us than some of our competitors because we sometimes acquire companies that may not have allocated significant resources and management focus to safety and environmental matters and may have a poor environmental and safety record and associated possible exposure.
Our insurance may not be adequate to cover all losses or liabilities we may suffer. Also, insurance may no longer be available to us or, if it is, its availability may be at premium levels that do not justify its purchase. The occurrence of a significant uninsured claim, a claim in excess of the insurance coverage limits maintained by us or a claim at a time when we are not able to obtain liability insurance could have a material adverse effect on our ability to conduct normal business operations and on our financial condition, results of operations and cash flows. In addition, we may not be able to secure additional insurance or bonding that might be required by new governmental regulations. This may cause us to restrict our operations, which might severely impact our financial position.
Since hydraulic fracturing activities are part of our operations, they are covered by our insurance against claims made for bodily injury, property damage and clean-up costs stemming from a sudden and accidental pollution event. However, we may not have coverage if we are unaware of the pollution event and unable to report the “occurrence” to our insurance company within the time frame required under our insurance policy. We have no coverage for gradual, long-term pollution events. In addition, these policies do not provide coverage for all liabilities, and the insurance coverage may not be adequate to cover claims that may arise, or we may not be able to maintain adequate insurance at rates we consider reasonable. A loss not fully covered by insurance could have a material adverse effect on our financial position, results of operations and cash flows.
We are subject to extensive environmental, health and safety laws and regulations that may subject us to substantial liability or require us to take actions that will adversely affect our results of operations.
Our business is significantly affected by stringent and complex federal, state and local laws and regulations governing the discharge of substances into the environment or otherwise relating to environmental protection and health and safety matters. As part of our business, we handle, transport and dispose of a variety of fluids and substances, including hydraulic fracturing fluids which can contain hydrochloric acid and certain petrochemicals. This activity poses some risks of environmental liability, including leakage of hazardous substances from the wells to surface and subsurface soils, surface water or groundwater. We also handle, transport and store these substances. The handling, transportation, storage and disposal of these fluids are regulated by a number of laws, including: the Resource Conservation and Recovery Act; the Comprehensive Environmental Response, Compensation, and Liability Act; the Clean Water Act; the Safe Drinking Water Act; and other federal and state laws and regulations promulgated thereunder. The cost of compliance with these laws can be significant. Failure to properly handle, transport or dispose of these materials or otherwise conduct our operations in accordance with these and other environmental laws could expose us to substantial liability for administrative, civil and criminal
30
penalties, cleanup and site restoration costs and liability associated with releases of such materials, damages to natural resources and other damages, as well as potentially impair our ability to conduct our operations. We could be exposed to liability for cleanup costs, natural resource damages and other damages under these and other environmental laws. Such liability is commonly on a strict, joint and several liability basis, without regard to fault. Liability may be imposed as a result of our conduct that was lawful at the time it occurred or the conduct of, or conditions caused by, prior operators or other third parties. Environmental laws and regulations have changed in the past, and they are likely to change in the future and become more stringent. If existing environmental requirements or enforcement policies change, we may be required to make significant unanticipated capital and operating expenditures.
The adoption of climate change legislation or regulations restricting emissions of greenhouse gases could result in increased operating costs and reduced demand for oil and natural gas.
In recent years, federal, state and local governments have taken steps to reduce emissions of greenhouse gases. The EPA has finalized a series of greenhouse gas monitoring, reporting and emissions control rules for the oil and natural gas industry, and the U.S. Congress has, from time to time, considered adopting legislation to reduce emissions. Almost one-half of the states have already taken measures to reduce emissions of greenhouse gases primarily through the development of greenhouse gas emission inventories and/or regional greenhouse gas cap-and-trade programs. In December 2015, the United States joined the international community at the 21st Conference of the Parties of the United Nations Framework Convention on Climate Change in Paris, France. The resulting Paris Agreement calls for the parties to undertake “ambitious efforts” to limit the average global temperature, and to conserve and enhance sinks and reservoirs of greenhouse gases. The Agreement, if ratified, establishes a framework for the parties to cooperate and report actions to reduce greenhouse gas emissions.
Restrictions on emissions of methane or carbon dioxide that may be imposed could adversely affect the oil and natural gas industry by reducing demand for hydrocarbons and by making it more expensive to develop and produce hydrocarbons, either of which could have a material adverse effect on future demand for our services. At this time, it is not possible to accurately estimate how potential future laws or regulations addressing greenhouse gas emissions would impact our business.
In addition, claims have been made against certain energy companies alleging that greenhouse gas emissions from oil and natural gas operations constitute a public nuisance under federal and/or state common law. As a result, private individuals may seek to enforce environmental laws and regulations against certain energy companies and could allege personal injury or property damages. While our business is not a party to any such litigation, we could be named in actions making similar allegations. An unfavorable ruling in any such case could significantly impact our operations and could have an adverse impact on our financial condition.
Moreover, climate change may cause more extreme weather conditions such as more intense hurricanes, thunderstorms, tornadoes and snow or ice storms, as well as rising sea levels and increased volatility in seasonal temperatures. Extreme weather conditions can interfere with our services and increase our costs, and damage resulting from extreme weather may not be fully insured. However, at this time, we are unable to determine the extent to which climate change may lead to increased storm or weather hazards affecting our operations.
Federal and state legislative and regulatory initiatives relating to hydraulic fracturing could result in increased costs and additional operating restrictions or delays.
Our business is dependent on our ability to conduct hydraulic fracturing and horizontal drilling activities. Hydraulic fracturing is an important common practice that is used to stimulate production of hydrocarbons, particularly natural gas, from tight formations, including shales. The process, which involves the injection of water, sand and chemicals (also called “proppants”) under pressure into formations to fracture the surrounding rock and stimulate production, is typically regulated by state oil and natural gas commissions. However, federal
31
agencies have asserted regulatory authority over certain aspects of the process. For example, on May 9, 2014, the EPA issued an Advanced Notice of Proposed Rulemaking seeking comment on the development of regulations under the Toxic Substances Control Act to require companies to disclose information regarding the chemicals used in hydraulic fracturing. The EPA plans to develop a Notice of Proposed Rulemaking by June 2017, which would describe a proposed mechanism—regulatory, voluntary or a combination of both—to collect data on hydraulic fracturing chemical substances and mixtures. On June 28, 2016, EPA published a final rule prohibiting the discharge of wastewater from onshore unconventional oil and natural gas extraction facilities to publicly owned wastewater treatment plans. The EPA is also conducting a study of private wastewater treatment facilities (also known as centralized waste treatment, or CWT, facilities) accepting oil and natural gas extraction wastewater. The EPA is collecting data and information related to the extent to which CWT facilities accept such wastewater, available treatment technologies (and their associated costs), discharge characteristics, financial characteristics of CWT facilities and the environmental impacts of discharges from CWT facilities. Furthermore, legislation to amend the Safe Drinking Water Act, or SDWA, to repeal the exemption for hydraulic fracturing (except when diesel fuels are used) from the definition of “underground injection” and require federal permitting and regulatory control of hydraulic fracturing, as well as legislative proposals to require disclosure of the chemical constituents of the fluids used in the fracturing process, were proposed in recent sessions of Congress.
On August 16, 2012, the EPA published final regulations under the federal Clean Air Act that establish new air emission controls for oil and natural gas production and natural gas processing operations. Specifically, the EPA’s rule package includes New Source Performance Standards to address emissions of sulfur dioxide and volatile organic compounds, or VOCs, and a separate set of emission standards to address hazardous air pollutants frequently associated with oil and natural gas production and processing activities. The final rule seeks to achieve a 95% reduction in VOCs emitted by requiring the use of reduced emission completions or “green completions” on all hydraulically-fractured wells constructed or refractured after January 1, 2015. The rules also establish specific new requirements regarding emissions from compressors, controllers, dehydrators, storage tanks and other production equipment. These rules required a number of modifications to our operations, including the installation of new equipment to control emissions. The EPA received numerous requests for reconsideration of these rules from both industry and the environmental community, and court challenges to the rules were also filed. In response, the EPA has issued, and will likely continue to issue, revised rules responsive to some of the requests for reconsideration. Recently, on May 12, 2016, the EPA amended the New Source Performance Standards to impose new standards for methane and VOC emissions for certain new, modified, and reconstructed equipment, processes, and activities across the oil and natural gas sector. On the same day, the EPA finalized a plan to implement its minor new source review program in Indian country for oil and natural gas production, and it issued for public comment an information request that will require companies to provide extensive information instrumental for the development of regulations to reduce methane emissions from existing oil and gas sources. At this point, we cannot predict the final regulatory requirements or the cost to comply with such requirements with any certainty.
There are certain governmental reviews either underway or being proposed that focus on the environmental aspects of hydraulic fracturing practices. These ongoing or proposed studies, depending on their degree of pursuit and whether any meaningful results are obtained, could spur initiatives to further regulate hydraulic fracturing under the SDWA or other regulatory authorities. The EPA continues to evaluate the potential impacts of hydraulic fracturing on drinking water resources and the induced seismic activity from disposal wells and has recommended strategies for managing and minimizing the potential for significant injection-induced seismic events. Other governmental agencies, including the U.S. Department of Energy, the U.S. Geological Survey and the U.S. Government Accountability Office, have evaluated or are evaluating various other aspects of hydraulic fracturing. These ongoing or proposed studies could spur initiatives to further regulate hydraulic fracturing, and could ultimately make it more difficult or costly to perform fracturing and increase the costs of compliance and doing business for our customers.
Several states, including Texas and Ohio, have adopted or are considering adopting regulations that could restrict or prohibit hydraulic fracturing in certain circumstances, impose more stringent operating standards and/
32
or require the disclosure of the composition of hydraulic fracturing fluids. Any increased regulation of hydraulic fracturing could reduce the demand for our services and materially and adversely affect our revenues and results of operations.
There has been increasing public controversy regarding hydraulic fracturing with regard to the use of fracturing fluids, induced seismic activity, impacts on drinking water supplies, use of water and the potential for impacts to surface water, groundwater and the environment generally. A number of lawsuits and enforcement actions have been initiated across the country implicating hydraulic fracturing practices. If new laws or regulations are adopted that significantly restrict hydraulic fracturing, such laws could make it more difficult or costly for us to perform fracturing to stimulate production from tight formations as well as make it easier for third parties opposing the hydraulic fracturing process to initiate legal proceedings based on allegations that specific chemicals used in the fracturing process could adversely affect groundwater. In addition, if hydraulic fracturing is further regulated at the federal, state or local level, our customers’ fracturing activities could become subject to additional permitting and financial assurance requirements, more stringent construction specifications, increased monitoring, reporting and recordkeeping obligations, plugging and abandonment requirements and also to attendant permitting delays and potential increases in costs. Such legislative or regulatory changes could cause us or our customers to incur substantial compliance costs, and compliance or the consequences of any failure to comply by us could have a material adverse effect on our financial condition and results of operations. At this time, it is not possible to estimate the impact on our business of newly enacted or potential federal, state or local laws governing hydraulic fracturing.
Penalties, fines or sanctions that may be imposed by the U.S. Mine Safety and Health Administration could have a material adverse effect on our proppant production and sales business and our overall financial condition, results of operations and cash flows.
The U.S. Mine Safety and Health Administration, or MSHA, has primary regulatory jurisdiction over commercial silica operations, including quarries, surface mines, underground mines, and industrial mineral process facilities. While we do not directly conduct any mining operations, we are dependent on several regulated mines for the supply of natural sand used in our proppant production. In addition, MSHA representatives perform at least two annual inspections of our production facilities to ensure employee and general site safety. As a result of these and future inspections and alleged violations and potential violations, we and our suppliers could be subject to material fines, penalties or sanctions. Any of our production facilities or our suppliers’ mines could be subject to a temporary or extended shut down as a result of an alleged MSHA violation. Any such penalties, fines or sanctions could have a material adverse effect on our proppant production and sales business and our overall financial condition, results of operations and cash flows.
Increasing trucking regulations may increase our costs and negatively impact our results of operations.
In connection with our business operations, including the transportation and relocation of our oilfield service equipment and shipment of frac sand, we operate trucks and other heavy equipment. As such, we operate as a motor carrier in providing certain of our services and therefore are subject to regulation by the United States Department of Transportation and by various state agencies. These regulatory authorities exercise broad powers, governing activities such as the authorization to engage in motor carrier operations, driver licensing, insurance requirements, financial reporting and review of certain mergers, consolidations and acquisitions, and transportation of hazardous materials (HAZMAT). Our trucking operations are subject to possible regulatory and legislative changes that may increase our costs. Some of these possible changes include increasingly stringent environmental regulations, changes in the hours of service regulations which govern the amount of time a driver may drive or work in any specific period, onboard black box recorder device requirements or limits on vehicle weight and size.
Interstate motor carrier operations are subject to safety requirements prescribed by the United States Department of Transportation. To a large degree, intrastate motor carrier operations are subject to state safety regulations that mirror federal regulations. Matters such as the weight and dimensions of equipment are also
33
subject to federal and state regulations. From time to time, various legislative proposals are introduced, including proposals to increase federal, state, or local taxes, including taxes on motor fuels, which may increase our costs or adversely impact the recruitment of drivers. We cannot predict whether, or in what form, any increase in such taxes applicable to us will be enacted.
Certain motor vehicle operators require registration with the Department of Transportation. This registration requires an acceptable operating record. The Department of Transportation periodically conducts compliance reviews and may revoke registration privileges based on certain safety performance criteria that could result in a suspension of operations.
Restrictions on drilling activities intended to protect certain species of wildlife may adversely affect our ability to conduct drilling activities in some of the areas where we operate.
Oil and natural gas operations in our operating areas can be adversely affected by seasonal or permanent restrictions on drilling activities designed to protect various wildlife, which may limit our ability to operate in protected areas. Permanent restrictions imposed to protect endangered species could prohibit drilling in certain areas or require the implementation of expensive mitigation measures. Additionally, the designation of previously unprotected species as threatened or endangered in areas where we operate could result in increased costs arising from species protection measures. Restrictions on oil and natural gas operations to protect wildlife could reduce demand for our services.
Conservation measures and technological advances could reduce demand for oil and natural gas and our services.
Fuel conservation measures, alternative fuel requirements, increasing consumer demand for alternatives to oil and natural gas, technological advances in fuel economy and energy generation devices could reduce demand for oil and natural gas, resulting in reduced demand for oilfield services. The impact of the changing demand for oil and natural gas services and products may have a material adverse effect on our business, financial condition, results of operations and cash flows.
Losses and liabilities from uninsured or underinsured drilling and operating activities could have a material adverse effect on our financial condition and operations.
The operational insurance coverage we maintain for our business may not fully insure us against all risks, either because insurance is not available or because of the high premium costs relative to perceived risk. Further, any insurance obtained by us may not be adequate to cover any losses or liabilities and this insurance may not continue to be available at all or on terms which are acceptable to us. Insurance rates have in the past been subject to wide fluctuation and changes in coverage could result in less coverage, increases in cost or higher deductibles and retentions. See “Business—Operating Risks and Insurance” for additional information on our insurance policies. Liabilities for which we are not insured, or which exceed the policy limits of our applicable insurance, could have a material adverse effect on our business activities, financial condition and results of operations.
We may be subject to claims for personal injury and property damage, which could materially adversely affect our financial condition and results of operations.
We operate with most of our customers under master service agreements, or MSAs. We endeavor to allocate potential liabilities and risks between the parties in the MSAs. Generally, under our MSAs, including those relating to our hydraulic fracturing services, we assume responsibility for, including control and removal of, pollution or contamination which originates above surface and originates from our equipment or services. Our customer assumes responsibility for, including control and removal of, all other pollution or contamination which may occur during operations, including that which may result from seepage or any other uncontrolled flow of drilling fluids. We may have liability in such cases if we are negligent or commit willful acts. Generally, our customers also agree to indemnify us against claims arising from their employees’ personal injury or death to the
34
extent that, in the case of our hydraulic fracturing operations, their employees are injured or their properties are damaged by such operations, unless resulting from our gross negligence or willful misconduct. Similarly, we generally agree to indemnify our customers for liabilities arising from personal injury to or death of any of our employees, unless resulting from gross negligence or willful misconduct of the customer. In addition, our customers generally agree to indemnify us for loss or destruction of customer-owned property or equipment and in turn, we agree to indemnify our customers for loss or destruction of property or equipment we own. Losses due to catastrophic events, such as blowouts, are generally the responsibility of the customer. However, despite this general allocation of risk, we might not succeed in enforcing such contractual allocation, might incur an unforeseen liability falling outside the scope of such allocation or may be required to enter into an MSA with terms that vary from the above allocations of risk. As a result, we may incur substantial losses which could materially and adversely affect our financial condition and results of operation.
Loss of our information and computer systems could adversely affect our business.
We are heavily dependent on our information systems and computer based programs, including our well operations information and accounting data. If any of such programs or systems were to fail or create erroneous information in our hardware or software network infrastructure, whether due to cyber attack or otherwise, possible consequences include our loss of communication links and inability to automatically process commercial transactions or engage in similar automated or computerized business activities. Any such consequence could have a material adverse effect on our business.
We are subject to cyber security risks. A cyber incident could occur and result in information theft, data corruption, operational disruption and/or financial loss.
The oil and natural gas industry has become increasingly dependent on digital technologies to conduct certain processing activities. For example, we depend on digital technologies to perform many of our services and process and record financial and operating data. At the same time, cyber incidents, including deliberate attacks or unintentional events, have increased. The U.S. government has issued public warnings that indicate that energy assets might be specific targets of cyber security threats. Our technologies, systems and networks, and those of its vendors, suppliers and other business partners, may become the target of cyberattacks or information security breaches that could result in the unauthorized release, gathering, monitoring, misuse, loss or destruction of proprietary and other information, or other disruption of its business operations. In addition, certain cyber incidents, such as surveillance, may remain undetected for an extended period. Our systems and insurance coverage for protecting against cyber security risks may not be sufficient. As cyber incidents continue to evolve, we may be required to expend additional resources to continue to modify or enhance our protective measures or to investigate and remediate any vulnerability to cyber incidents. Our insurance coverage for cyberattacks may not be sufficient to cover all the losses we may experience as a result of such cyberattacks.
Risks Inherent to this Offering and Our Common Stock
Our two largest stockholders control a significant percentage of our common stock, and their interests may conflict with those of our other stockholders.
Immediately prior to the completion of this offering, Wexford and Gulfport will beneficially own 68.7% and 30.5%, respectively, of the Company’s equity interests. Upon completion of this offering, Wexford, through its affiliate Mammoth Holdings, and Gulfport will beneficially own approximately % and %, respectively, of our common stock, or % and %, respectively, if the underwriters exercise their option to purchase additional shares in full. See “Principal and Selling Stockholders” beginning on page 112 of this prospectus. As a result, Wexford and Gulfport together, will be able to control, and Wexford alone, will continue to be able to exercise significant influence, over matters requiring stockholder approval, including the election of directors, changes to our organizational documents and significant corporate transactions. Further, we anticipate that several individuals who will serve as our directors upon completion of this offering will be affiliates of Wexford and Gulfport. This concentration of ownership and relationships with Wexford and Gulfport make it unlikely that
35
any other holder or group of holders of our common stock will be able to affect the way we are managed or the direction of our business. In addition, we have engaged, and expect to continue to engage, in related party transactions involving Wexford and Gulfport, and certain companies they control. See “Certain Relationships and Related Party Transactions.” The interests of Wexford and Gulfport with respect to matters potentially or actually involving or affecting us, such as services provided, future acquisitions, financings and other corporate opportunities, and attempts to acquire us, may conflict with the interests of our other stockholders. This continued concentrated ownership will make it impossible for another company to acquire us and for you to receive any related takeover premium for your shares unless these stockholders approve the acquisition.
A significant reduction by Wexford or Gulfport of their ownership interests in us could adversely affect us.
We believe that Wexford’s and Gulfport’s substantial ownership interests in us provides them with an economic incentive to assist us to be successful. Upon the expiration or earlier waiver of the lock-up restrictions on transfers or sales of our securities following the completion of this offering, neither Wexford nor Gulfport will be subject to any obligation to maintain its ownership interest in us and may elect at any time thereafter to sell all or a substantial portion of or otherwise reduce its ownership interest in us. If Wexford or Gulfport sells all or a substantial portion of its ownership interest in us, it may have less incentive to assist in our success and its affiliate(s) that are expected to serve as members of our board of directors may resign. Such actions could adversely affect our ability to successfully implement our business strategies which could adversely affect our cash flows or results of operations.
We will incur increased costs as a result of being a public company, which may significantly affect our financial condition.
As a public company, we will incur significant legal, accounting and other expenses that we did not incur as a private company. We will incur costs associated with our public company reporting requirements. We also anticipate that we will incur costs associated with corporate governance requirements, including requirements under the Sarbanes-Oxley Act of 2002 and the Dodd-Frank Act of 2010, as well as rules implemented by the SEC, The NASDAQ Global Select Market and the Financial Industry Regulatory Authority. We expect these rules and regulations to increase our legal and financial compliance costs and to make some activities more time-consuming and costly, particularly after we are no longer an “emerging growth company.” For example, as a result of becoming a publicly traded company, we are required to have at least three independent directors and adopt policies regarding internal controls and disclosure controls and procedures, including the preparation of reports on internal control over financial reporting. We also expect these rules and regulations may make it more difficult and more expensive for us to obtain director and officer liability insurance and we may be required to accept reduced policy limits and coverage or incur substantially higher costs to obtain the same or similar coverage. As a result, it may be more difficult for us to attract and retain qualified individuals to serve on our board of directors or as executive officers. We are currently evaluating these rules, and we cannot predict or estimate the amount of additional costs we may incur or the timing of such costs.
However, for as long as we remain an “emerging growth company” as defined in the Jumpstart Our Business Startups Act enacted by the U.S. Congress in April 2012, or the JOBS Act, we intend to take advantage of certain exemptions from various reporting requirements that are applicable to other public companies that are not “emerging growth companies” including, but not limited to, not being required to comply with the auditor attestation requirements of Section 404 of the Sarbanes-Oxley Act, reduced disclosure obligations regarding executive compensation in our periodic reports and proxy statements, and exemptions from the requirements of holding a nonbinding advisory vote on executive compensation and stockholder approval of any golden parachute payments not previously approved. We intend to take advantage of these reporting exemptions until we are no longer an “emerging growth company.”
We could be an “emerging growth company” for up to five years following the completion of our initial public offering, although, if we have more than $1.0 billion in annual revenue, if the market value of our common stock that is held by non-affiliates exceeds $700 million as of June 30 of any year, or we issue more
36
than $1.0 billion of non-convertible debt over a three-year period before the end of that five-year period, we would cease to be an “emerging growth company” as of the following December 31st.
We estimate that we will incur approximately $2.6 million of incremental costs per year associated with being a publicly traded company; however, it is possible that our actual incremental costs of being a publicly traded company will be higher than we currently estimate. After we are no longer an “emerging growth company,” we expect to incur significant additional expenses and devote substantial management effort toward ensuring compliance with those requirements applicable to companies that are not “emerging growth companies,” including Section 404 of the Sarbanes-Oxley Act. See “—Risks Related to Our Business and the Oil and Natural Gas Industry—We will be subject to certain requirements of Section 404 of the Sarbanes-Oxley Act. If we are unable to timely comply with Section 404 or if the costs related to compliance are significant, our profitability, stock price, results of operations and financial condition could be materially adversely affected.”
For so long as we are an “emerging growth company” we will not be required to comply with certain disclosure requirements that are applicable to other public companies and we cannot be certain if the reduced disclosure requirements applicable to emerging growth companies will make our common stock less attractive to investors.
We are an “emerging growth company,” as defined in the JOBS Act, and we may take advantage of certain exemptions from various reporting requirements that are applicable to other public companies, including, but not limited to, not being required to comply with the auditor attestation requirements of Section 404 of the Sarbanes-Oxley Act, reduced disclosure obligations regarding executive compensation in our periodic reports and proxy statements, and exemptions from the requirements of holding a nonbinding advisory vote on executive compensation and stockholder approval of any golden parachute payments not previously approved. We cannot predict if investors will find our common stock less attractive because we will rely on these exemptions. If some investors find our common stock less attractive as a result, there may be a less active trading market for our common stock and our common stock price may be more volatile.
Under the JOBS Act, “emerging growth companies” can delay adopting new or revised accounting standards until such time as those standards apply to private companies. Prior to the completion of this offering, we intend to irrevocably elect not to avail ourselves to this exemption from new or revised accounting standards and, therefore, we will be subject to the same new or revised accounting standards as other public companies that are not “emerging growth companies.”
We will be subject to certain requirements of Section 404 of the Sarbanes-Oxley Act. If we are unable to timely comply with Section 404 or if the costs related to compliance are significant, our profitability, stock price, results of operations and financial condition could be materially adversely affected.
We will be required to comply with certain provisions of Section 404 of the Sarbanes-Oxley Act of 2002. Section 404 requires that we document and test our internal control over financial reporting and issue management’s assessment of our internal control over financial reporting. This section also requires that our independent registered public accounting firm opine on those internal controls upon becoming an accelerated filer, as defined in the SEC rules, or otherwise ceasing to qualify for an exemption from the requirement to provide auditors’ attestation on internal controls afforded to emerging growth companies under the JOBS Act. We are currently evaluating our existing controls against the standards adopted by the Committee of Sponsoring Organizations of the Treadway Commission. During the course of our ongoing evaluation and integration of the internal control over financial reporting, we may identify areas requiring improvement, and we may have to design enhanced processes and controls to address issues identified through this review. For example, we anticipate the need to hire additional administrative and accounting personnel to conduct our financial reporting.
We believe that the out-of-pocket costs, the diversion of management’s attention from running the day-to-day operations and operational changes caused by the need to comply with the requirements of Section 404 of the Sarbanes-Oxley Act could be significant. If the time and costs associated with such compliance exceed our current expectations and our results of operations could be adversely affected.
37
We cannot be certain at this time that we will be able to successfully complete the procedures, certification and attestation requirements of Section 404 or that we or our auditors will not identify material weaknesses in internal control over financial reporting. If we fail to comply with the requirements of Section 404 or if we or our auditors identify and report such material weaknesses, the accuracy and timeliness of the filing of our annual and quarterly reports may be materially adversely affected and could cause investors to lose confidence in our reported financial information, which could have a negative effect on the trading price of our common stock. In addition, a material weakness in the effectiveness of our internal control over financial reporting could result in an increased chance of fraud and the loss of customers, reduce our ability to obtain financing and require additional expenditures to comply with these requirements, each of which could have a material adverse effect on our business, results of operations and financial condition.
Since we are a “controlled company” for purposes of The NASDAQ Global Select Market’s corporate governance requirements, our stockholders will not have, and may never have, the protections that these corporate governance requirements are intended to provide.
Since we are a “controlled company” for purposes of The NASDAQ Global Select Market’s corporate governance requirements, we are not required to comply with the provisions requiring that a majority of our directors be independent, the compensation of our executives be determined by independent directors or nominees for election to our board of directors be selected by independent directors. If we choose to take advantage of any or all of these exemptions, our stockholders may not have the protections that these rules are intended to provide.
The corporate opportunity provisions in our certificate of incorporation could enable Wexford, Gulfport or other affiliates of ours to benefit from corporate opportunities that might otherwise be available to us.
Subject to the limitations of applicable law, our certificate of incorporation, among other things:
| • | permits us to enter into transactions with entities in which one or more of our officers or directors are financially or otherwise interested; |
| • | permits any of our stockholders, officers or directors to conduct business that competes with us and to make investments in any kind of property in which we may make investments; and |
| • | provides that if any director or officer of one of our affiliates who is also one of our officers or directors becomes aware of a potential business opportunity, transaction or other matter (other than one expressly offered to that director or officer in writing solely in his or her capacity as our director or officer), that director or officer will have no duty to communicate or offer that opportunity to us, and will be permitted to communicate or offer that opportunity to such affiliates and that director or officer will not be deemed to have (i) acted in a manner inconsistent with his or her fiduciary or other duties to us regarding the opportunity or (ii) acted in bad faith or in a manner inconsistent with our best interests. |
These provisions create the possibility that a corporate opportunity that would otherwise be available to us may be used for the benefit of one of our affiliates.
We have engaged in transactions with our affiliates and expect to do so in the future. The terms of such transactions and the resolution of any conflicts that may arise may not always be in our or our common stockholders’ best interests.
We have engaged in transactions and expect to continue to engage in transactions with affiliated companies. As described in “Certain Relationships and Related Party Transactions” these include, among others, agreements to provide our services and frac sand products to our affiliates and agreements pursuant to
38
which our affiliates provide or will provide us with certain services, including administrative and advisory services and office space. Each of these entities is either controlled by or affiliated with Wexford or Gulfport, as the case may be, and the resolution of any conflicts that may arise in connection with such related party transactions, including pricing, duration or other terms of service, may not always be in our or our stockholders’ best interests because Wexford and/or Gulfport may have the ability to influence the outcome of these conflicts. For a discussion of potential conflicts, see “—Risks Inherent to this Offering and Our Common Stock—Our two largest stockholders control a significant percentage of our common stock, and their interests may conflict with those of our other stockholders.”
There has been no public market for our common stock and if the price of our common stock fluctuates significantly, your investment could lose value.
Prior to this offering, there has been no public market for our common stock. Although we have applied for a listing of our common stock on The NASDAQ Global Market, an active public market may not develop for our common stock or that our common stock will trade in the public market subsequent to this offering at or above the initial public offering price. If an active public market for our common stock does not develop, the trading price and liquidity of our common stock will be materially and adversely affected. If there is a thin trading market or “float” for our common stock, the market price for our common stock may fluctuate significantly more than the stock market as a whole. Without a large float, our common stock is less liquid than the securities of companies with broader public ownership and, as a result, the trading prices of our common stock may be more volatile. In addition, in the absence of an active public trading market, investors may be unable to liquidate their investment in us. The initial offering price, which will be negotiated between us and the underwriters, may not be indicative of the trading price for our common stock after this offering. In addition, the stock market is subject to significant price and volume fluctuations, and the price of our common stock could fluctuate widely in response to several factors, including:
| • | our quarterly or annual operating results; |
| • | changes in our earnings estimates; |
| • | investment recommendations by securities analysts following our business or our industry; |
| • | additions or departures of key personnel; |
| • | changes in the business, earnings estimates or market perceptions of our competitors; |
| • | our failure to achieve operating results consistent with securities analysts’ projections; |
| • | changes in industry, general market or economic conditions; and |
| • | announcements of legislative or regulatory change. |
The stock market has experienced extreme price and volume fluctuations in recent years that have significantly affected the quoted prices of the securities of many companies, including companies in our industry. The changes often appear to occur without regard to specific operating performance. The price of our common stock could fluctuate based upon factors that have little or nothing to do with our company and these fluctuations could materially reduce the price for our common stock.
Upon completion of this offering, Wexford and Gulfport will beneficially own a substantial number of our common stock and may sell such common stock in the public or private markets. Future sales of these shares of common stock or substantial amounts of our common stock, or the perception that such sales may occur, could adversely affect the prevailing market price of our common stock.
Upon completion of this offering, Wexford and Gulfport will beneficially own and shares of our common stock, respectively, or and shares of our common stock, respectively, if the
39
underwriters’ over-allotment option is exercised in full. Future sales of these shares of common stock or substantial amounts of our common stock, or the perception that such sales may occur, could adversely affect the prevailing market price of our common stock. In addition, the sale of these shares could impair our ability to raise capital through the sale of additional common or preferred stock. After this offering, we will have shares of common stock outstanding, excluding any equity awards granted under our equity incentive plan. All of the shares common of stock sold in this offering, except for any our common stock purchased by our affiliates, will be freely tradable.
Mammoth Holdings, Gulfport and Rhino, as the selling stockholders in this offering, and our directors and executive officers will be subject to agreements that limit their ability to sell our common stock held by them. These holders cannot sell or otherwise dispose of any shares of our common stock for a period of at least days after the date of this prospectus, which period may be extended under limited circumstances, without the prior written approval of the representative of the underwriters. However, these lock-up agreements are subject to certain specific exceptions. In the event that one or more of our stockholders sells a substantial amount of our common stock in the public market, or the market perceives that such sales may occur, the price of our stock could decline.
If securities or industry analysts do not publish research or reports about our business, if they adversely change their recommendations regarding our stock or if our operating results do not meet their expectations, the price of our stock could decline.
The trading market for our common stock will be influenced by the research and reports that industry or securities analysts publish about us or our business. If one or more of these analysts cease coverage of our company or fail to publish reports on us regularly, we could lose visibility in the financial markets, which in turn could cause our stock price or trading volume to decline. Moreover, if one or more of the analysts who cover our company downgrades our stock or if our operating results do not meet their expectations, our stock price could decline.
Purchasers in this offering will experience immediate dilution and will experience further dilution with the future vesting or exercise of equity awards granted under our equity incentive plan.
The initial public offering price is substantially higher than the pro forma net tangible book value per share of common stock of our outstanding common stock. As a result, you will experience immediate and substantial dilution of approximately $ per share of common stock, representing the difference between our net tangible book value per share of common stock as of June 30, 2016 after giving effect to this offering and an assumed initial public offering price of $ (which is the midpoint of the range set forth on the cover of the prospectus). A $1.00 increase (decrease) in the assumed initial public offering price of $ per share of common stock (which is the midpoint of the range set forth on the cover page of this prospectus) would increase (decrease) our net tangible book value per share of common stock after giving effect to this offering by $ , and increase (decrease) the dilution to new investors by $ , assuming the number of share of common stock offered by us, as set forth on the cover page of this prospectus, remains the same and after deducting the estimated underwriting discounts and commissions and estimated offered expenses payable by us. See “Dilution” for a description of dilution.
We may issue preferred stock whose terms could adversely affect the voting power or value of our common stock.
Our certificate of incorporation authorizes us to issue, without the approval of our stockholders, one or more classes or series of preferred stock having such designations, preferences, limitations and relative rights, including preferences over our common stock respecting dividends and distributions, as our board of directors may determine. The terms of one or more classes or series of preferred stock could adversely impact the voting power or value of our common stock. For example, we might grant holders of preferred stock the right to elect
40
some number of our directors in all events or on the happening of specified events or the right to veto specified transactions. Similarly, the repurchase or redemption rights or liquidation preferences we might assign to holders of preferred stock could affect the residual value of the common stock.
Provisions in our certificate of incorporation and bylaws and Delaware law make it more difficult to effect a change in control of the company, which could adversely affect the price of our common stock.
The existence of some provisions in our certificate of incorporation and bylaws and Delaware corporate law could delay or prevent a change in control of our company, even if that change would be beneficial to our stockholders. Our certificate of incorporation and bylaws contain provisions that may make acquiring control of our company difficult, including:
| • | provisions regulating the ability of our stockholders to nominate directors for election or to bring matters for action at annual meetings of our stockholders; |
| • | limitations on the ability of our stockholders to call a special meeting and act by written consent; |
| • | the ability of our board of directors to adopt, amend or repeal bylaws, and the requirement that the affirmative vote of holders representing at least 66 2/3% of the voting power of all outstanding shares of capital stock be obtained for stockholders to amend our bylaws; |
| • | the requirement that the affirmative vote of holders representing at least 66 2/3% of the voting power of all outstanding shares of capital stock be obtained to remove directors; |
| • | the requirement that the affirmative vote of holders representing at least 66 2/3% of the voting power of all outstanding shares of capital stock be obtained to amend our certificate of incorporation; and |
| • | the authorization given to our board of directors to issue and set the terms of preferred stock without the approval of our stockholders. |
These provisions also could discourage proxy contests and make it more difficult for you and other stockholders to elect directors and take other corporate actions. As a result, these provisions could make it more difficult for a third party to acquire us, even if doing so would benefit our stockholders, which may limit the price that investors are willing to pay in the future for shares of our common stock.
Our certificate of incorporation designates courts in the State of Delaware as the sole and exclusive forum for certain types of actions and proceedings that may be initiated by our stockholders, which could limit our stockholders’ ability to obtain a favorable judicial forum for disputes with us or our directors, officers or other employees.
Our certificate of incorporation provides that, subject to limited exceptions, the Court of Chancery of the State of Delaware will be the sole and exclusive forum for:
| • | Any derivative action or proceeding brought on our behalf; |
| • | Any action asserting a claim of breach of fiduciary duty owed by any of our directors, officers or other employees to us or our stockholders; |
| • | Any action asserting a claim against us arising pursuant to any provision of the Delaware General Corporation Law; or |
| • | Any other action asserting a claim against us that is governed by the internal affairs doctrine. |
41
In addition, our certificate of incorporation provides that if any action specified above (each is referred to herein as a covered proceeding), is filed in a court other than the specified Delaware courts without the approval of our board of directors (each is referred to herein as a foreign action), the claiming party will be deemed to have consented to (i) the personal jurisdiction of the specified Delaware courts in connection with any action brought in any such courts to enforce the exclusive forum provision described above and (ii) having service of process made upon such claiming party in any such enforcement action by service upon such claiming party’s counsel in the foreign action as agent for such claiming party.
These provisions may limit a stockholder’s ability to bring a claim in a judicial forum that it finds favorable for disputes with us or our directors, officers or other employees, which may discourage such lawsuits against us and our directors, officers and employees. Alternatively, if a court were to find these provisions of our certificate of incorporation inapplicable to, or unenforceable in respect of, one or more of the covered proceedings, we may incur additional costs associated with resolving such matters in other jurisdictions, which could adversely affect our business and financial condition.
We do not intend to pay cash dividends on our common stock in the foreseeable future, and therefore only appreciation of the price of our common stock will provide a return to our stockholders.
We currently anticipate that we will retain all future earnings, if any, to finance the growth and development of our business. We do not intend to pay cash dividends in the foreseeable future. Any future determination as to the declaration and payment of cash dividends will be at the discretion of our board of directors and will depend upon our financial condition, results of operations, contractual restrictions, capital requirements, business prospects and other factors deemed relevant by our board of directors. In addition, the terms of our revolving credit facility prohibit us from paying dividends and making other distributions. As a result, only appreciation of the price of our common stock, which may not occur, will provide a return to our stockholders.
42
CAUTIONARY NOTE REGARDING FORWARD-LOOKING STATEMENTS
This prospectus contains forward-looking statements. These forward-looking statements are subject to a number of risks and uncertainties, many of which are beyond our control, which may include statements about our:
| • | business strategy; |
| • | planned acquisitions and future capital expenditures; |
| • | ability to obtain permits and governmental approvals; |
| • | technology; |
| • | financial strategy; |
| • | future operating results; and |
| • | plans, objectives, expectations and intentions. |
All of these types of statements, other than statements of historical fact included in this prospectus, are forward-looking statements. These forward-looking statements may be found in the “Prospectus Summary,” “Risk Factors,” “Management’s Discussion and Analysis of Financial Condition and Results of Operations,” “Business” and other sections of this prospectus. In some cases, you can identify forward-looking statements by terminology such as “may,” “could,” “should,” “expect,” “plan,” “project,” “budget,” “intend,” “anticipate,” “believe,” “estimate,” “predict,” “potential,” “pursue,” “target,” “seek,” “objective” or “continue,” the negative of such terms or other comparable terminology.
The forward-looking statements contained in this prospectus are largely based on our expectations, which reflect estimates and assumptions made by our management. These estimates and assumptions reflect our best judgment based on currently known market conditions and other factors. Although we believe such estimates and assumptions to be reasonable, they are inherently uncertain and involve a number of risks and uncertainties that are beyond our control. In addition, our management’s assumptions about future events may prove to be inaccurate. Our management cautions all readers that the forward-looking statements contained in this prospectus are not guarantees of future performance, and we cannot assure any reader that such statements will be realized or the forward-looking events and circumstances will occur. Actual results may differ materially from those anticipated or implied in the forward-looking statements due to the many factors including those described in the “Risk Factors” section and elsewhere in this prospectus. All forward-looking statements speak only as of the date of this prospectus. We do not intend to publicly update or revise any forward-looking statements as a result of new information, future events or otherwise. These cautionary statements qualify all forward-looking statements attributable to us or persons acting on our behalf.
43
Our net proceeds from the sale of shares of common stock in this offering, assuming a public offering price of $ per share (which is the midpoint of the range set forth on the cover of this prospectus), are estimated to be $ million, after deducting underwriting discounts and commissions and estimated offering expenses. The net proceeds we receive are estimated to be $ million if the underwriters’ option to purchase additional shares is exercised in full. We intend to use the net proceeds from this offering to repay our outstanding borrowings under our revolving credit facility. Any remaining net proceeds will be used for other general corporate purposes, which may include the acquisition of additional equipment and complementary businesses.
As of June 30, 2016, we had $82.3 million in borrowings outstanding under our revolving credit facility, with a weighted average interest rate of 3.3%. As of August 1, 2016, our outstanding borrowings under our revolving credit facility were $80.0 million. Our revolving credit facility matures on November 25, 2019.
An increase or decrease in the initial public offering price of $1.00 per share would cause the net proceeds that we will receive in this offering to increase or decrease by approximately $ million.
We will not receive any proceeds from the sale of shares by the selling stockholders, including any sale the selling stockholders may make upon exercise of the underwriters’ option to purchase additional shares.
44
Mammoth Energy Services, Inc. has never declared or paid any cash dividends on its capital stock. We currently intend to retain all available funds and any future earnings for use in the operation and expansion of our business and do not anticipate declaring or paying any cash dividends in the foreseeable future. Any future determination as to the declaration and payment of dividends will be at the discretion of our board of directors and will depend on then-existing conditions, including our financial condition, results of operations, contractual restrictions, capital requirements, business prospects and other factors that our board of directors considers relevant. In addition, the terms of our existing outstanding borrowings restrict the payment of dividends to the holders of our common stock and any other equity holders.
45
The following table sets forth our cash and cash equivalents and capitalization as of June 30, 2016:
| • | on an actual basis; |
| • | pro forma as adjusted to give effect to (i) the issuance of shares of common stock, in the aggregate, to Mammoth Holdings, Gulfport and Rhino in the contribution, and (ii) the sale of shares of our common stock in this offering at an assumed initial public offering price of $ per share of common stock (which is the midpoint of the range set forth on the cover of this prospectus), our receipt of an estimated $ million of net proceeds from this offering after deducting underwriting discounts and commissions and estimated offering expenses and the use of a portion of those proceeds to repay outstanding borrowings under our revolving credit facility. See “Use of Proceeds.” |
This table does not reflect the issuance of up to shares of our common stock that may be sold to the underwriters upon exercise of their option to purchase additional shares from us, or the use of the resulting proceeds. You should read the following table in conjunction with “Management’s Discussion and Analysis of Financial Condition and Results of Operations” and our consolidated financial statements and related notes appearing elsewhere in this prospectus.
| As of June 30, 2016 | ||||||||
| Actual (1) | Pro Forma As Adjusted (2) |
|||||||
| (in thousands) | ||||||||
| Cash and cash equivalents |
$ | 938 | $ | |||||
|
|
|
|
|
|||||
| Long-term debt (including current maturities)(3) |
$ | 82,300 | $ | |||||
| Unitholders’ equity: |
||||||||
| General partner |
- | |||||||
| Common units, 30,000,000 units issued and outstanding as of June 30, 2016 |
299,576 | |||||||
| Stockholders’ equity: |
||||||||
| Common stock, par value $0.01; 100 shares authorized and 100 shares issued and outstanding actual; shares authorized and shares issued and outstanding as adjusted for the offering |
- | |||||||
| Additional paid-in capital |
- | |||||||
| Accumulated earnings(4) |
- | |||||||
|
|
|
|
|
|||||
| Accumulated other comprehensive loss |
(3,957) | |||||||
|
|
|
|
|
|||||
| Total stockholders’/unitholders’ equity |
295,619 | |||||||
|
|
|
|
|
|||||
| Total capitalization |
$ | 377,919 | $ | |||||
|
|
|
|
|
|||||
| (1) | Mammoth Energy Services, Inc. was formed in June 2016 and has not and will not conduct any material business operations prior to the contribution other than certain activities related to the preparation of the registration statement for this offering. Mammoth Energy Services, Inc. is a wholly-owned subsidiary of Mammoth Partners. Immediately prior to the effectiveness of the registration statement of which this prospectus is a part, Mammoth Partners will convert to a Delaware limited liability company named Mammoth Energy Partners LLC, and Mammoth Holdings, Gulfport and Rhino will contribute their respective interests in Mammoth Partners LLC to Mammoth Energy Services, Inc., and Mammoth Partners LLC will become its wholly-owned subsidiary. The data in the “Actual” column of this table has been derived from the historical consolidated financial statements and other financial information of Mammoth Partners and its consolidated subsidiaries included in this prospectus. |
46
| (2) | A $1.00 increase (decrease) in the assumed initial public offering price of $ per share (which is the midpoint of the range set forth on the cover of this prospectus) would increase (decrease) each of cash and cash equivalents, additional paid-in-capital and total capitalization by $ million, assuming the number of shares offered by us, as set forth on the cover page of this prospectus, remains the same and after deducting the estimated underwriting discounts and commissions and estimated offering expenses payable by us. |
| (3) | Represents borrowings outstanding under our revolving credit agreements, which borrowings will be repaid in full with a portion of the net proceeds from this offering. |
| (4) | Upon completion of this offering, we will recognize deferred tax liabilities and assets for temporary differences between the historical cost basis and tax basis of our assets and liabilities. Based on estimates of those temporary differences as of June 30, 2016, a net deferred tax liability of approximately $58.4 million will be recognized with a corresponding charge to earnings. |
47
Dilution is the amount by which the offering price paid by the purchasers of our common stock sold in this offering will exceed the pro forma net tangible book value per share after the offering. Our reported net tangible book value as of June 30, 2016 was $ million. Net tangible book value per share before the offering is determined by dividing the net tangible book value (total tangible assets less total liabilities) by the number of shares of common stock ( shares) to be issued to Mammoth Holdings, Gulfport and Rhino in connection with the contribution. Assuming the sale by us of shares of common stock offered in this offering at an estimated initial public offering price of $ per share (which is the midpoint of the range set forth on the cover of this prospectus) and after deducting the underwriting discounts and commissions and estimated offering expenses payable by us, our net tangible book value as of June 30, 2016 would have been approximately $ million, or $ per share, after giving pro forma effect to the contribution. This represents an immediate increase in net tangible book value of $ per share to our existing stockholders and an immediate dilution of $ per share to new investors purchasing shares at the initial public offering price.
The following table illustrates the per share dilution:
| Assumed initial public offering price per share |
$ | |||||||
| Net tangible book value per share as of June 30, 2016 |
$ | |||||||
| Increase per share attributable to new investors |
$ | |||||||
|
|
|
|||||||
| As adjusted net tangible book value per share after the offering |
$ | |||||||
|
|
|
|||||||
| Dilution per share to new investors |
$ | |||||||
|
|
|
A $1.00 increase (decrease) in the assumed initial public offering price of $ per share (which is the midpoint of the range set forth in the cover of this prospectus) would increase (decrease) our net tangible book value after the offering by $ , and increase (decrease) the dilution to new investors by $ , assuming the number of shares offered by us, as set forth on the cover page of this prospectus, remains the same and after deducting the estimated underwriting discounts and commissions and estimated offering expenses payable by us.
The following table sets forth, as of June 30, 2016, after giving pro forma effect to the contribution, the number of shares to be issued by us in the contribution, the holders of which will be our existing equity holders immediately prior to the closing of this offering, and by the new investors at the assumed initial public offering price of $ per share, together with the total consideration paid and average price per share paid by each of these groups, before deducting underwriting discounts and commissions and estimated offering expenses.
| Common Shares Purchased |
Total Consideration | Average Price | ||||||||||||||||||
| Number | Percent | Amount | Percent | Per Share | ||||||||||||||||
| Existing stockholders |
% | $ | % | $ | ||||||||||||||||
| New investors |
% | % | ||||||||||||||||||
|
|
|
|
|
|
|
|
|
|
|
|||||||||||
| Total |
100.0% | $ | 100.0% | $ | ||||||||||||||||
|
|
|
|
|
|
|
|
|
|
|
|||||||||||
If the underwriters’ option to purchase additional shares is exercised in full, the number of shares held by new investors will be increased to , or approximately % of the total number of shares of common stock.
The date in the table excludes shares of common stock reserved for issuance under our equity incentive plan.
48
SELECTED HISTORICAL CONSOLIDATED FINANCIAL DATA
The following table sets forth our selected historical consolidated financial data as of and for each of the periods indicated. The selected historical consolidated financial data as of December 31, 2015 and 2014 and for the years ended December 31, 2015 and 2014 are derived from the historical audited consolidated financial statements of Mammoth Partners and its consolidated subsidiaries included elsewhere in this prospectus. The selected consolidated historical financial data as of June 30, 2016 and for the six months ended June 30, 2016 and 2015 are derived from the historical unaudited consolidated financial statements of Mammoth Partners and its consolidated subsidiaries included elsewhere in this prospectus. The selected consolidated historical balance sheet data as of June 30, 2015 are derived from the unaudited consolidated balance sheet of Mammoth Partners and its consolidated subsidiaries as of such date, which is not included in this prospectus. The unaudited pro forma C Corporation financial data presented give effect to income taxes assuming we operated as a taxable corporation since January 1, 2014. Operating results for the years ended December 31, 2015 and 2014 and the six months ended June 30, 2016 and 2015 are not necessarily indicative of results that may be expected for any future periods. You should review this information together with “Management’s Discussion and Analysis of Financial Condition and Results of Operations” and the historical consolidated financial statements and related notes of Mammoth Partners and its consolidated subsidiaries included elsewhere in this prospectus.
| Historical (1) | ||||||||||||||||
| Six Months Ended (1) June 30, |
Year Ended (1) December 31, |
|||||||||||||||
| 2016 | 2015 | 2015 | 2014 | |||||||||||||
| Statement of Operations Data (2): |
||||||||||||||||
| Revenue: |
||||||||||||||||
| Services revenue |
$ | 46,887,094 | $ | 111,672,225 | $ | 172,012,405 | $ | 182,341,309 | ||||||||
| Services revenue – related parties |
40,714,870 | 73,305,163 | 132,674,989 | 30,834,421 | ||||||||||||
| Product revenue |
2,155,807 | 13,373,845 | 16,732,077 | 36,859,731 | ||||||||||||
| Product revenue – related parties |
13,688,020 | 21,584,555 | 38,517,222 | 9,490,543 | ||||||||||||
|
|
|
|
|
|
|
|
|
|||||||||
| Total revenue |
103,445,791 | 219,935,788 | 359,936,693 | 259,526,004 | ||||||||||||
|
|
|
|
|
|
|
|
|
|||||||||
| Cost and expenses (3): |
||||||||||||||||
| Services cost of revenue (exclusive of depreciation and amortization) |
66,264,807 | 132,085,648 | 225,820,450 | 150,482,793 | ||||||||||||
| Services cost of revenue (exclusive of depreciation and amortization) – related parties |
4,551,718 | 3,042,931 | 4,177,335 | 1,770,565 | ||||||||||||
| Product cost of revenue (exclusive of depreciation and amortization) |
3,939,766 | 18,632,060 | 25,838,555 | 35,525,596 | ||||||||||||
| Product cost of revenue (exclusive of depreciation and amortization) – related parties |
9,516,307 | 12,102,723 | 20,510,977 | 3,289,947 | ||||||||||||
|
|
|
|
|
|
|
|
|
|||||||||
| Total cost of revenue |
84,272,598 | 165,863,362 | 276,347,317 | 191,068,901 | ||||||||||||
|
|
|
|
|
|
|
|
|
|||||||||
| Selling, general and administrative (exclusive of depreciation and amortization) |
7,664,158 | 9,402,890 | 19,303,557 | 14,272,986 | ||||||||||||
| Selling, general and administrative (exclusive of depreciation and amortization) – related parties |
386,637 | 447,691 | 1,237,991 | 2,754,877 | ||||||||||||
|
|
|
|
|
|
|
|
|
|||||||||
| Total selling, general and administrative |
8,050,795 | 9,850,581 | 20,541,548 | 17,027,863 | ||||||||||||
| Depreciation and amortization |
35,667,383 | 35,736,832 | 72,393,882 | 35,627,165 | ||||||||||||
| Impairment of long-lived assets |
1,870,885 | 4,470,781 | 12,124,353 | — | ||||||||||||
|
|
|
|
|
|
|
|
|
|||||||||
| Total cost and expenses |
129,861,661 | 215,921,556 | 381,407,100 | 243,723,929 | ||||||||||||
|
|
|
|
|
|
|
|
|
|||||||||
| Operating (loss) income |
(26,415,870) | 4,014,232 | (21,470,407) | 15,802,075 | ||||||||||||
49
| Historical (1) | ||||||||||||||||
| Six Months Ended (1) June 30, |
Year Ended (1) December 31, |
|||||||||||||||
| 2016 | 2015 | 2015 | 2014 | |||||||||||||
| Other Income (Expense): |
||||||||||||||||
| Interest income |
— | 98,242 | 98,492 | 214,141 | ||||||||||||
| Interest expense |
(2,109,205) | (2,806,330) | (5,290,821) | (4,603,595) | ||||||||||||
| Interest expense – related parties |
— | — | — | (184,479) | ||||||||||||
| Other, net |
694,690 | (2,092,485) | (2,157,764) | (5,724,496) | ||||||||||||
|
|
|
|
|
|
|
|
|
|||||||||
| Total other expense |
(1,414,515) | (4,800,573) | (7,350,093) | (10,298,429) | ||||||||||||
|
|
|
|
|
|
|
|
|
|||||||||
| (Loss) income before income taxes |
(27,830,385) | (786,341) | (28,820,500) | 5,503,646 | ||||||||||||
| Provision (benefit) for income taxes |
1,683,735 | 1,573,136 | (1,589,086) | 7,514,194 | ||||||||||||
|
|
|
|
|
|
|
|
|
|||||||||
| Net loss |
$ | (29,514,120) | $ | (2,359,477) | $ | (27,231,414) | $ | (2,010,548) | ||||||||
|
|
|
|
|
|
|
|
|
|||||||||
| Other Comprehensive Income (Loss): |
||||||||||||||||
| Foreign currency translation adjustment, net of tax of $0 for the six months ended June 30, 2016 and 2015 and $0 and $298,170 for the years ended December 31, 2015 and 2014, respectively |
1,969,858 | (1,617,441) | (4,814,819) | 472,714 | ||||||||||||
|
|
|
|
|
|
|
|
|
|||||||||
| Comprehensive loss |
$ | (27,544,262) | $ | (3,976,918) | $ | (32,046,233) | $ | (1,537,834) | ||||||||
|
|
|
|
|
|
|
|
|
|||||||||
| Pro Forma C Corporation Data (1): |
||||||||||||||||
| Historical (loss) income before income taxes |
$ | (27,830,385) | $ | (786,341) | $ | (28,820,500) | $ | 5,503,646 | ||||||||
| Pro forma (benefit) provision for income taxes |
(3,287,051) | (3,431,215) | (4,058,116) | 12,721,822 | ||||||||||||
|
|
|
|
|
|
|
|
|
|||||||||
| Pro forma net (loss) income |
$ | (24,543,334) | $ | 2,644,874 | $ | (24,762,384) | $ | (7,218,176) | ||||||||
|
|
|
|
|
|
|
|
|
|||||||||
| Pro forma (loss) income per common share—basic and diluted |
$ | $ | 0.09 | $ | $ | (0.34) | ||||||||||
|
|
|
|
|
|
|
|
|
|||||||||
| Weighted average pro forma shares outstanding—basic and diluted (4) |
30,000,000 | 21,056,073 | ||||||||||||||
|
|
|
|
|
|
|
|
|
|||||||||
| Other Financial Data: |
||||||||||||||||
| Adjusted EBITDA(5) |
$ | 11,122,398 | $ | 44,221,845 | $ | 63,047,828 | $ | 55,268,082 | ||||||||
|
|
|
|
|
|
|
|
|
|||||||||
| Cash flows provided by operating activities |
$ | 11,842,981 | $ | 43,911,916 | $ | 68,392,616 | $ | 8,247,714 | ||||||||
|
|
|
|
|
|
|
|
|
|||||||||
| Purchases of property and equipment |
$ | (2,548,958) | $ | (20,574,047) | $ | (26,251,675) | $ | (111,690,056) | ||||||||
| Other investing activities, net |
3,165,516 | 320,273 | 1,416,766 | 10,125,141 | ||||||||||||
|
|
|
|
|
|
|
|
|
|||||||||
| Cash flows provided by (used in) investing activities |
$ | 616,558 | $ | (20,253,774) | $ | (24,834,909) | $ | (101,564,915) | ||||||||
|
|
|
|
|
|
|
|
|
|||||||||
| Capital contributions |
$ | — | $ | — | $ | (711) | $ | 51,768,502 | ||||||||
| Proceeds from financing arrangements, net of repayments |
(14,602,516) | (28,648,742) | (55,930,761) | 51,369,550 | ||||||||||||
| Other financing activities, net |
— | — | — | (12,301) | ||||||||||||
|
|
|
|
|
|
|
|
|
|||||||||
| Cash flows (used in) provided by financing activities |
$ | (14,602,516) | $ | (28,648,742) | $ | (55,931,472) | $ | 103,125,751 | ||||||||
|
|
|
|
|
|
|
|
|
|||||||||
50
| Historical (1) | ||||||||||||||||
| As of June 30, | As of December 31, | |||||||||||||||
| 2016 | 2015 | 2015 | 2014 | |||||||||||||
| Balance sheet data: |
||||||||||||||||
| Current Assets: |
||||||||||||||||
| Cash and cash equivalents |
$ | 938,068 | $ | 10,872,354 | $ | 3,074,072 | $ | 15,674,492 | ||||||||
| Accounts receivable, net |
19,318,282 | 33,373,885 | 17,797,852 | 49,002,910 | ||||||||||||
| Receivables from related parties |
33,933,501 | 40,847,841 | 25,643,781 | 35,142,962 | ||||||||||||
| Inventories |
4,476,480 | 4,956,168 | 4,755,661 | 4,220,401 | ||||||||||||
| Prepaid expenses |
4,979,878 | 4,631,900 | 4,447,253 | 9,171,113 | ||||||||||||
| Other current assets |
581,788 | 618,809 | 422,219 | 1,002,011 | ||||||||||||
|
|
|
|
|
|
|
|
|
|||||||||
| Total current assets |
64,227,997 | 95,300,957 | 56,140,838 | 114,213,889 | ||||||||||||
| Property, plant and equipment, net |
241,104,996 | 312,159,842 | 273,026,665 | 334,150,453 | ||||||||||||
| Intangible assets, net – customer relationships |
20,129,772 | 28,753,439 | 24,309,772 | 32,956,971 | ||||||||||||
| Intangible assets, net – trade names |
5,972,557 | 6,683,557 | 6,328,057 | 7,038,900 | ||||||||||||
| Goodwill |
86,043,148 | 86,131,395 | 86,043,148 | 86,131,395 | ||||||||||||
| Other non-current assets |
5,537,684 | 5,318,094 | 5,137,090 | 6,223,268 | ||||||||||||
|
|
|
|
|
|
|
|
|
|||||||||
| Total assets |
$ | 423,016,154 | $ | 534,347,284 | $ | 450,985,570 | $ | 580,714,876 | ||||||||
|
|
|
|
|
|
|
|
|
|||||||||
| Liabilities: |
||||||||||||||||
| Current liabilities |
$ | 43,127,062 | $ | 55,500,169 | $ | 30,790,175 | $ | 71,108,086 | ||||||||
| Long-term debt |
82,300,000 | 120,000,000 | 95,000,000 | 146,041,013 | ||||||||||||
| Deferred income taxes |
1,596,577 | 6,807,993 | 1,460,959 | 7,476,580 | ||||||||||||
| Other liabilities |
373,515 | 806,545 | 571,174 | 878,991 | ||||||||||||
|
|
|
|
|
|
|
|
|
|||||||||
| Total liabilities |
127,397,154 | 183,114,707 | 127,822,308 | 225,504,670 | ||||||||||||
|
|
|
|
|
|
|
|
|
|||||||||
| Total unitholders’ equity |
295,619,000 | 351,232,577 | 323,163,262 | 355,210,206 | ||||||||||||
|
|
|
|
|
|
|
|
|
|||||||||
| Total liabilities and unitholders’ equity |
$ | 423,016,154 | $ | 534,347,284 | $ | 450,985,570 | $ | 580,714,876 | ||||||||
|
|
|
|
|
|
|
|
|
|||||||||
| (1) | Mammoth Energy Services, Inc. was formed in June 2016, and has not and will not conduct any material business operations prior to the contribution described below other than certain activities related to the preparation of the registration statement for this offering. Mammoth Energy Services, Inc. is a wholly-owned subsidiary of Mammoth Partners. Except as expressly noted otherwise, the historical financial information of Mammoth Energy Services, Inc. included in this prospectus is derived from the consolidated financial statements of Mammoth Partners and its consolidated subsidiaries. Mammoth Partners was treated as a partnership for federal income tax purposes. As a result, essentially all of the taxable earnings and losses of Mammoth Partners were passed through to its limited partners, and Mammoth Partners did not pay federal income taxes at the entity level. Immediately prior to the effectiveness of the registration statement of which this prospectus is a part, Mammoth Partners will convert to a Delaware limited liability company named Mammoth Energy Partners LLC, and Mammoth Holdings, Gulfport and Rhino will contribute their respective interests in Mammoth Partners LLC to Mammoth Energy Services, Inc., and Mammoth Partners LLC will become its wholly-owned subsidiary. In connection with the contribution, all of the subsidiaries of Mammoth Partners will become subsidiaries of Mammoth Energy Services, Inc. and, because we will be a subchapter C corporation under the Code, all of our subsidiaries’ earning will become subject to federal income tax. For comparative purposes, we have included a pro forma financial data for the historical periods to give effect to income taxes assuming the earnings of these entities had been subject to federal income tax as a subchapter C corporation since inception. The unaudited pro forma data is presented for informational purposes only, and does not purport to project our results of operations for any future period or our financial position as of any future date. |
| (2) | Related party revenue, costs and expenses are those that we paid to or received from one or more affiliated parties. |
| (3) | See pages F-4 and F-33 for depreciation and amortization amounts excluded by line item and by period. |
51
| (4) | Unaudited pro forma basic and diluted income (loss) per share will be presented for the latest fiscal year and interim period on the basis of the aggregate number of shares to be issued in connection with the contribution, upon determination of the number of those shares. |
| (5) | Adjusted EBITDA is a supplemental non-GAAP financial measure that is used by management and external users of our financial statements, such as industry analysts, investors, lenders and rating agencies. We define Adjusted EBITDA as net loss before interest expense, interest income, provision (benefit) for income taxes, depreciation and amortization expense, impairment of long-lived assets, equity based compensation and other non-operating income or expense, net (which is comprised of the (gain) or loss on disposal of long-lived assets, as well as charges associated with Mammoth Partner’s proposed public offering in 2014). We exclude the items listed above from net loss in arriving at Adjusted EBITDA because these amounts can vary substantially from company to company within our industry depending upon accounting methods and book values of assets, capital structures and the method by which the assets were acquired. Adjusted EBITDA should not be considered as alternative to, or more meaningful than, net income (loss) or cash flows from operating activities as determined in accordance with GAAP or as an indicator of our operating performance or liquidity. Certain items excluded from Adjusted EBITDA are significant components in understanding and assessing a company’s financial performance, such as a company’s cost of capital and tax structure, as well as the historic costs of depreciable assets, none of which are components of Adjusted EBITDA. Our computations of Adjusted EBITDA may not be comparable to other similarly titled measures of other companies. We believe that Adjusted EBITDA is a widely followed measure of operating performance and may also be used by investors to measure our ability to meet debt service requirements. |
The following tables present a reconciliation of the non-GAAP financial measure of Adjusted EBITDA to the GAAP financial measure of net income (loss).
| Historical (1) | ||||||||||||||||
| Six Months Ended June 30, |
Year Ended December 31, |
|||||||||||||||
| 2016 | 2015 | 2015 | 2014 | |||||||||||||
| Reconciliation of Adjusted EBITDA to net loss: |
|
|||||||||||||||
| Net loss |
$ (29,514,120) | $ | (2,359,477) | $ (27,231,414) | $ | (2,010,548) | ||||||||||
| Depreciation and amortization expense |
35,667,383 | 35,736,832 | 72,393,882 | 35,627,165 | ||||||||||||
| Impairment of long-lived assets |
1,870,885 | 4,470,781 | 12,124,353 | — | ||||||||||||
| Equity based compensation |
— | — | — | 3,838,842 | ||||||||||||
| Interest income |
— | (98,242) | (98,492) | (214,141) | ||||||||||||
| Interest expense |
2,109,205 | 2,806,330 | 5,290,821 | 4,788,074 | ||||||||||||
| Other non-operating (income) expense, net |
(694,690) | 2,092,485 | 2,157,764 | 5,724,496 | ||||||||||||
| Provision (benefit) for income taxes |
1,683,735 | 1,573,136 | (1,589,086) | 7,514,194 | ||||||||||||
|
|
|
|
|
|
|
|
|
|||||||||
| Adjusted EBITDA |
$ 11,122,398 | $ | 44,221,845 | $ 63,047,828 | $ | 55,268,082 | ||||||||||
|
|
|
|
|
|
|
|
|
|||||||||
52
MANAGEMENT’S DISCUSSION AND ANALYSIS OF FINANCIAL CONDITION
AND RESULTS OF OPERATIONS
The following discussion and analysis should be read in conjunction with the “Prospectus Summary—Summary Consolidated Historical and Pro Forma Financial Data,” “Selected Historical Consolidated Financial Data,” and the historical consolidated financial statements and related notes included elsewhere in this prospectus. This discussion contains forward-looking statements reflecting our current expectations and estimates and assumptions concerning events and financial trends that may affect our future operating results or financial position. Actual results and the timing of events may differ materially from those contained in these forward-looking statements due to a number of factors, including those discussed in the sections entitled “Risk Factors” and “Cautionary Note Regarding Forward-Looking Statements” appearing elsewhere in this prospectus.
Company Overview
We are an integrated, growth-oriented oilfield service company providing completion and production, natural sand proppant services, contract land and directional drilling and remote accommodation services primarily to companies engaged in the exploration and development of North American onshore unconventional oil and natural gas reserves.
Mammoth Energy Services, Inc. was formed in June 2016, and has not and will not conduct any material business operations prior to the contribution described below other than certain activities related to the preparation of the registration statement for this offering. Mammoth Energy Services, Inc. is a wholly-owned subsidiary of Mammoth Partners. On November 24, 2014, Mammoth Holdings, Gulfport and Rhino contributed to Mammoth Partners their respective interests in the following entities: Bison Drilling; Bison Trucking; White Wing; Barracuda; Panther Drilling; Redback Energy Services; Redback Coil Tubing; Pump Down; Muskie Proppant; Pressure Pumping; Logistics; and Sand Tiger. Upon completion of these contributions, Mammoth Holdings, Gulfport and Rhino beneficially owned a 68.7%, 30.5% and 0.8% equity interest, respectively, in Mammoth Partners. Subsequently, Mammoth Partners formed Pumpdown, Mr. Inspections and Silverback as wholly-owned subsidiaries. Immediately prior to the effectiveness of the registration statement of which this prospectus is a part, Mammoth Partners will convert to a Delaware limited liability company named Mammoth Energy Partners LLC, and Mammoth Holdings, Gulfport and Rhino will contribute their respective interests in Mammoth Partners LLC to Mammoth Energy Services, Inc., and Mammoth Partners LLC will become its wholly-owned subsidiary. Except as expressly noted otherwise, the historical financial information of Mammoth Energy Services, Inc. included in this prospectus is derived from the consolidated financial statements of Mammoth Partners and its consolidated subsidiaries. The historical consolidated financial information of Mammoth Partners included in this prospectus is not indicative of the results that may be expected in any future periods. For more information, please see “Prospectus Summary—Summary Consolidated Historical and Pro Forma Financial Data” and related notes thereto included elsewhere in this prospectus.
Since the dates presented below, we have conducted our operations through the following entities, which comprise our four operating divisions: completion and production services, natural sand proppant services, contract land and directional drilling services, and remote accommodation services. These entities commenced operations on the dates indicated below.
| • | Completion and Production Services Division |
| • | Redback Energy Services—October 2011 |
| • | Pressure Pumping—March 2012 |
| • | Redback Coil Tubing—May 2012 |
53
| • | Logistics—November 2012 |
| • | Barracuda—October 2014 |
| • | Pumpdown—January 2015 |
| • | Mr. Inspections—January 2015 |
| • | Silverback—June 2016 |
| • | Natural Sand Proppant Services Division |
| • | Muskie Proppant—September 2011 |
| • | Contract Land and Directional Drilling Services Division |
| • | Bison Drilling—November 2010 |
| • | Panther Drilling—December 2012 |
| • | Bison Trucking—August 2013 |
| • | White Wing—September 2014 |
| • | Remote Accommodation Services Division |
| • | Sand Tiger—October 2007 |
Our completion and production division provides pressure pumping services, flowback services and equipment rental. Our natural sand proppant division sells, distributes, and is capable of producing proppant for hydraulic fracturing. Our contract land and directional drilling services division provides drilling rigs and crews for operators as well as rental equipment, such as mud motors and operational tools, for both vertical and horizontal drilling. Our remote accommodations division provides housing, kitchen and dining, and recreational service facilities for oilfield workers located in remote areas away from readily available lodging.
Our customers are predominantly independent oil and natural gas exploration and production companies, and oilfield service companies that use natural sand proppant for hydraulic fracturing. We have facilities and service centers that are strategically located to primarily serve resource plays in the United States, including the Utica Shale in Eastern Ohio, the Permian Basin in West Texas, the Marcellus Shale in Pennsylvania, the Granite Wash in Oklahoma and Texas, the Cana Woodford Shale and the Cleveland Sand in Oklahoma, the Eagle Ford shale in South Texas and the oil sands in Alberta, Canada.
Our primary business objective is to grow our operations and create value for our stockholders through growth opportunities and accretive acquisitions. To achieve this objective, we plan to:
| • | capitalize on the activity in the unconventional resource plays primarily in the Permian Basin and Utica Shale, using our equipment which is designed to provide services for unconventional wells; |
| • | grow our existing customer relationships by cross selling our services and expanding to other geographic regions in which our customers operate; |
| • | monitor demand and expand our service offerings as warranted by investing in new equipment and facilities, initially focusing on our hydraulic fracturing and natural sand proppant businesses, to add services and extend our presence in areas that we currently serve and other geographic locations; and |
54
| • | grow our business, relationships and service offerings by acquiring select companies and assets that are accretive and enhance our existing service offerings, broaden our service offerings or expand our customer relationships. |
Industry Overview
The oil and natural gas industry has traditionally been volatile and is influenced by a combination of long-term, short-term and cyclical trends, including the domestic and international supply and demand for oil and natural gas, current and expected future prices for oil and natural gas and the perceived stability and sustainability of those prices, production depletion rates and the resultant levels of cash flows generated and allocated by exploration and production companies to their drilling, completion and related services and products budget. The oil and natural gas industry is also impacted by general domestic and international economic conditions, political instability in oil producing countries, government regulations (both in the United States and elsewhere), levels of customer demand, the availability of pipeline capacity and other conditions and factors that are beyond our control.
Demand for most of our products and services depends substantially on the level of expenditures by companies in the oil and natural gas industry. The significant decline in oil and natural gas prices that began in the third quarter of 2014 continued into February 2016, when the closing price of oil reached a 12-year low of $26.19 per barrel on February 11, 2016. The low commodity price environment caused a reduction in the drilling, completion and other production activities of most of our customers and their spending on our products and services.
The reduction in demand, and the resulting oversupply of many of the services and products we provide, has substantially reduced the prices we can charge our customers for our products and services, and has had a negative impact on the utilization of our services. This overall trend with respect to our customers’ activities and spending has continued in 2016. However, oil prices have increased since the 12-year low recorded on February 26, 2016, reaching $51.23 per barrel in June 2016, and have ranged from $39.50 to $48.48 per barrel during August 2016. As commodity prices have begun to recover, we have experienced an increase in activity. If near term commodity prices stabilize at current levels and recover further, we expect to experience further increase in demand for our services and products, particularly in our completion and production, natural sand proppant and contract land and directional drilling businesses. We expect our remote accommodation revenues to remain stable through the third quarter of 2016. However, we currently project that our remote accommodation revenues will decrease in the fourth quarter of 2016 if we are unable to replace one customer that represented approximately 80.6% of our remote accommodation services during the first half of 2016 when it completes the construction phase of its project, which is currently estimated to occur in October 2016.
55
Results of Operations
The following table sets forth selected operating data for the periods indicated.
| Six Months Ended June 30, |
Year Ended December 31, |
|||||||||||||||
| 2016 | 2015 | 2015 | 2014 | |||||||||||||
| Revenue: |
||||||||||||||||
| Completion and production services |
$ | 61,315,426 | $ | 121,501,144 | $ | 198,832,027 | $ | 70,032,778 | ||||||||
| Contract land and directional drilling services |
11,632,429 | 44,620,105 | 73,032,089 | 122,164,943 | ||||||||||||
| Natural sand proppant services |
15,843,827 | 34,958,400 | 52,790,203 | 46,350,274 | ||||||||||||
| Remote accommodation services |
14,654,109 | 18,856,139 | 35,282,374 | 20,978,009 | ||||||||||||
|
|
|
|
|
|
|
|
|
|||||||||
| Total revenue |
103,445,791 | 219,935,788 | 359,936,693 | 259,526,004 | ||||||||||||
|
|
|
|
|
|
|
|
|
|||||||||
| Cost of revenue: |
||||||||||||||||
| Completion and production services |
51,399,808 | 93,841,530 | 159,861,774 | 49,008,738 | ||||||||||||
| Contract land and directional drilling services |
12,968,054 | 33,367,535 | 57,489,609 | 93,571,050 | ||||||||||||
| Natural sand proppant production |
13,456,073 | 30,734,783 | 43,890,437 | 38,815,543 | ||||||||||||
| Remote accommodation services |
6,448,663 | 7,919,514 | 15,105,497 | 9,673,570 | ||||||||||||
|
|
|
|
|
|
|
|
|
|||||||||
| Total cost of revenue |
84,272,598 | 165,863,362 | 276,347,317 | 191,068,901 | ||||||||||||
|
|
|
|
|
|
|
|
|
|||||||||
| Selling, general and administrative expenses |
8,050,795 | 9,850,581 | 20,541,548 | 17,027,863 | ||||||||||||
| Depreciation and amortization |
35,667,383 | 35,736,832 | 72,393,882 | 35,627,165 | ||||||||||||
| Impairment of long-lived assets |
1,870,885 | 4,470,781 | 12,124,353 | — | ||||||||||||
|
|
|
|
|
|
|
|
|
|||||||||
| Operating (loss) income |
(26,415,870) | 4,014,232 | (21,470,407) | 15,802,075 | ||||||||||||
| Interest expense, net |
(2,109,205) | (2,708,088) | (5,192,329) | (4,573,933) | ||||||||||||
| Other (expense) income, net |
694,690 | (2,092,485) | (2,157,764) | (5,724,496) | ||||||||||||
|
|
|
|
|
|
|
|
|
|||||||||
| (Loss) income before income taxes |
(27,830,385) | (786,341) | (28,820,500) | 5,503,646 | ||||||||||||
| Provision (benefit) for income taxes |
1,683,735 | 1,573,136 | (1,589,086) | 7,514,194 | ||||||||||||
|
|
|
|
|
|
|
|
|
|||||||||
| Net loss |
$ | (29,514,120) | $ | (2,359,477) | $ | (27,231,414) | $ | (2,010,548) | ||||||||
|
|
|
|
|
|
|
|
|
|||||||||
Six Months Ended June 30, 2016 Compared to Six Months Ended June 30, 2015
Revenue. Revenue for the six months ended June 30, 2016 decreased $116.5 million, or 53.0%, to $103.4 million from $219.9 million for the six months ended June 30, 2015. The decrease in revenue by operating division was as follows:
Completion and Production Services. Completion and production services division revenue decreased $60.2 million, or 49.5%, to $61.3 million for the six months ended June 30, 2016 from $121.5 million for the six months ended June 30, 2015. The decrease was primarily attributable to reduction in demand for our pressure pumping services, which accounted for $45.9 million, or 76.2%, of the operating division decrease. The decrease in our pressure pumping services revenue was driven by a decline in fleet utilization from 87%, on three active fleets, for the six months ended June 30, 2015 to 50%, on two active fleets, for the six months ended June 30, 2016, primarily attributable to the suspension of pressure pumping services by Gulfport during the first quarter of 2016. The services and fees so suspended have been reallocated and are being paid during the second and third quarters of 2016. Our flowback services accounted for $8.8 million, or 14.6%, of our operating division decrease, as a result of discontinuing our flowback operations in the Appalachian Basin in December 2015 combined with a decline in both pricing
56
and utilization of such services in our other basins. Our coil tubing services accounted for $3.2 million, or 5.3%, of our operating division decrease, as a result of a decline in average day rates from approximately $29,800 for the six months ended June 30, 2015 to approximately $18,500 for the six months ended June 30, 2016. Our pump down services accounted for $2.3 million, or 3.8%, of our operating division decrease, as a result of our suspension of pump down services in the Woodford Shale during the fourth quarter of 2015.
Contract Land and Directional Drilling Services. Contract land and directional drilling services division revenue decreased $33.0 million, or 74.0%, from $44.6 million for the six months ended June 30, 2015 to $11.6 million for the six months ended June 30, 2016. The decrease was primarily attributable to a decline in demand for our land drilling services, which accounted for $27.8 million, or 84.2%, of the operating division decrease. The decrease in our land drilling services was driven by a decline in average active rigs from ten for the six months ended June 30, 2015 to three for the six months ended June 30, 2016 as well as a decline in average day rates from approximately $20,000 to approximately $13,000 during those same periods. Our directional drilling services accounted for $3.7 million, or 11.2%, of the operating division decrease as a result of utilization declining from 36% for the six months ended June 30, 2015 to 14% for the six months ended June 30, 2016. Our rig moving services accounted for $1.3 million, or 3.9%, of the operating division decrease primarily driven by the decline in our land drilling services. Our drill pipe inspection services accounted for $0.2 million, or 0.7%, of the operating division decrease as a result of the decline in our land drilling services.
Natural Sand Proppant Services. Natural sand proppant services division revenue decreased $19.2 million, or 54.9%, to $15.8 million for the six months ended June 30, 2016, from $35.0 million for the six months ended June 30, 2015. The decrease was primarily attributable to the decline in our pressure pumping services, which resulted in a decline in tons of sand sold from approximately 343,000 in the six months ended June 30, 2015 to approximately 241,000 in the six months ended June 30, 2016 and a 45.1% decrease in the average price per ton of sand sold.
Remote Accommodation Services. Remote accommodation services division revenue decreased $4.2 million, or 22.2%, to $14.7 million for the six months ended June 30, 2016 from $18.9 million for the six months ended June 30, 2015. The decrease was a result of a decrease of $5.00 in average revenue per room night from $184 for the six months ended June 30, 2015 to $179 for the six months ended June 30, 2016 and a 9.0% decrease in total room nights from 126,345 for the six months ended June 30, 2015 to 114,942 for the six months ended June 30, 2016.
Cost of Revenue. Cost of revenue decreased $81.6 million from $165.9 million, or 75.4% of total revenue, for the six months ended June 30, 2015 to $84.3 million, or 81.5% of total revenue, for the six months ended June 30, 2016. Cost of revenue by operating division was as follows:
Completion and Production Services. Completion and production services division cost of revenue decreased $42.5 million, or 45.3%, from $93.9 million for the six months ended June 30, 2015 to $51.4 million for the six months ended June 30, 2016. The decrease was primarily due to decreases in proppant costs, repairs and maintenance expense and labor-related costs as a result of decreased utilization. As a percentage of revenue, our completion and production services division cost of revenue was 83.8% and 77.3% for the six months ended June 30, 2016 and 2015, respectively. The increase in costs as a percentage of revenue was primarily due to a reduction in demand for our services.
Contract Land and Directional Drilling Services. Contract land and directional drilling services division cost of revenue decreased $20.4 million, or 61.1%, from $33.4 million for the six months ended June 30, 2015 to $13.0 million for the six months ended June 30, 2016, primarily due to a decrease in labor-related costs and lower utilization. As a percentage of revenue, our contract land and directional
57
drilling services division cost of revenue was 112.1% and 74.9% for the six months ended June 30, 2016 and 2015, respectively. The increase as a percentage of revenue was primarily due to declines in average active rigs from ten for the six months ended June 30, 2015 to three for the six months ended June 30, 2016 as well as a decline in average day rates from approximately $20,000 to approximately $13,000 during the same periods.
Natural Sand Proppant Services. Natural sand proppant services division cost of revenue decreased $17.2 million, or 56.0%, from $30.7 million for the six months ended June 30, 2015 to $13.5 million for the six months ended June 30, 2016, primarily due to a decrease in product costs, labor-related costs and a reduction in product purchased due to the decrease in our pressure pumping services during the six months ended June 30, 2016. As a percentage of revenue, cost of revenue was 85.4% and 87.7% for the six months ended June 30, 2016 and 2015, respectively. The decrease as a percentage of revenue was primarily due to a reduction in product and labor-related costs.
Remote Accommodation Services. Remote accommodation services division cost of revenue decreased $1.5 million, or 19.0% from $7.9 million the six months ended June 30, 2015 to $6.4 million for the six months ended June 30, 2016, primarily due to declines in contracted labor-related costs. As a percentage of revenue, cost of revenue was 43.5% and 41.8% for the six months ended June 30, 2016 and 2015, respectively. The increase as a percentage of revenue was primarily due to increased pricing pressure, which resulted in a decrease in average revenue per room night from $184 for the six months ended June 30, 2015 to $179 for the six months ended June 30, 2016.
Selling, General and Administrative Expenses. Selling, general and administrative expenses represent the costs associated with managing and supporting our operations. These expenses decreased $1.8 million, or 18.2%, to $8.1 million for the six months ended June 30, 2016, from $9.9 million for the six months ended June 30, 2015. The decrease in expenses was primarily attributable to a $1.6 million reduction in compensation and benefits for the six months ended June 30, 2016 compared to the six months ended June 30, 2015. In addition to the decrease in compensation and benefits, professional fees decreased by $0.2 million for the six months ended June 30, 2016 compared to the six months ended June 30, 2015. The remaining decrease period-over period was primarily driven by decreases in both office and computer support expense.
Depreciation and Amortization. Depreciation and amortization was $35.7 million for the six months ended June 30, 2016 compared to $35.7 million for the six months ended June 30, 2015.
Impairment of Long-Lived Assets. We recorded an impairment of long-lived assets of $1.9 million for the six months ended June 30, 2016, compared to $4.5 million for the six months ended June 30, 2015. For the six months ended June 30, 2016, the impairment was attributable to various fixed assets. The impairment during the six months ended June 30, 2015, was attributable to $2.6 million in various fixed assets and $1.9 million on a terminated long-term contract.
Other (Expense) Income, Net. Other income, net was $0.7 million for the six months ended June 30, 2016, consisting primarily of the gain on disposal of long-lived assets, compared to other expense, net of $2.0 million for the six months ended June 30, 2015, consisting primarily of the loss on disposal of long-lived assets.
Interest Expense. Interest expense decreased $0.7 million, or 25.0%, to $2.1 million during the six months ended June 30, 2016, compared to $2.8 million in the six months ended June 30, 2015. The decrease in interest expense was attributable to a decrease in average borrowings during the six months ended June 30, 2016.
Income Taxes. We are treated as a pass-through entity for federal income tax and most state income tax purposes. The income tax expense recognized was primarily attributable to Sand Tiger, which provides our remote accommodation services. For the six months ended June 30, 2016, we recognized income tax expense of
58
$1.7 million compared to an income tax expense of $1.6 million for the six months ended June 30, 2015. The change was primarily attributable to the six months ended June 30, 2015 including, at the level of Sand Tiger’s immediate parent, a federal income tax credit of $0.6 million associated with foreign income taxes incurred by Sand Tiger. Prior to 2015 year-end, however, an entity election was filed with the IRS to make this holding entity for Sand Tiger a disregarded entity, thus negating the ability to accrue and utilize foreign tax credits at the partnership level.
Net Loss. Net loss for the six months ended June 30, 2016 was $29.5 million, compared to a net loss of $2.4 million for the six months ended June 30, 2015. Net loss by operating division was as follows:
Completion and Production Services. Completion and production services division net loss was $16.1 million for the six months ended June 30, 2016, compared to net income of $2.1 million for the six months ended June 30, 2015. The decrease in net income was primarily attributable to our pressure pumping services, which experienced a 37% decline in utilization period-over-period.
Contract Land and Directional Drilling Services. Contract land and directional drilling services net loss was $16.7 million for the six months ended June 30, 2016, compared to net loss of $9.7 million for the six months ended June 30, 2015. The increase in net loss was primarily attributable to a decline in the average active number of rigs from ten during the six months ended June 30, 2015 to three for the six months ended June 30, 2016. Additionally, increases in impairments period over period contributed to the increase in net loss.
Natural Sand Proppant Services. Natural sand proppant services net loss was $1.0 million for the six months ended June 30, 2016, compared to net loss of $1.4 million for the six months ended June 30, 2015. The change in net loss period-over-period was primarily due to the decline in revenue partially offset by decreases in impairments.
Remote Accommodation Services. Remote accommodation services division net income was $4.3 million for the six months ended June 30, 2016, compared to $6.7 million for the six months ended June 30, 2015. The decrease in net income was primarily attributable to an average $5.00 decrease in revenue per room night and a 9.0% decrease in total room nights, partially offset by a decrease in provision for income taxes of $0.5 million.
Year Ended December 31, 2015 Compared to Year Ended December 31, 2014
Revenue. Revenue for the year ended December 31, 2015 increased $100.4 million, or 38.7%, to $359.9 million from $259.5 million for the year ended December 31, 2014. The net increase in revenue by operating division was as follows:
Completion and Production Services. Completion and production services division revenue increased $128.6 million, or 183.2%, to $198.8 million for the year ended December 31, 2015 from $70.2 million for the year ended December 31, 2014. The increase was primarily attributable to our pressure pumping services, which were acquired in connection with our acquisition of Stingray Pressure Pumping LLC in November 2014 and accounted for $149.2 million, or 116.0% of the division increase in revenue. The increase in revenue in our pressure pumping services was partially offset by decreases in revenue from both our coil tubing and flowback services, which decreased $9.7 million and $6.8 million, respectively. The decreases in revenue generated by our coil tubing and flowback services were 7.5% and 5.3%, respectively, of the net increase in revenues. Revenue generated by our remaining services in the completion and production services division declined by $4.1 million, or 3.2% of the net increase in division revenue. This decrease was primarily driven by a decline in utilization in our pump down services, which saw a drop in utilization from 51% for the year ended December 31, 2014 to 21% for the year ended December 31, 2015.
59
Contract Land and Directional Drilling Services. Contract land and directional drilling services division revenue decreased $49.0 million, or 40.2%, to $73.0 million for the year ended December 31, 2015, from $122.0 million for the year ended December 31, 2014. The decrease was primarily attributable to a decrease in revenue of $41.2 million, or 84.1% of the net division decrease in revenue. The decrease in revenue was primarily attributable to a decline in average active rigs from 12 in 2014 to eight in 2015 as well as a decline in average day rates from $18,900 to $17,900 during those same periods. For the year ended December 31, 2015, our directional drilling services division saw a reduction of $8.1 million, or 16.5%, of the net division decrease in revenue. Our rig moving and drill pipe inspection service lines saw a combined increase in revenue of $0.3 million, or 0.8%, of the net decrease in revenue primarily driven by a full year of revenue from our drill pipe inspection service line, which began operations in September 2014.
Natural Sand Proppant Services. Natural sand proppant services division revenue increased $6.5 million, or 14.0%, to $52.8 million for the year ended December 31, 2015, from $46.3 million for the year ended December 31, 2014. The increase was primarily attributable to an increase in our pressure pumping services.
Remote Accommodation Services. Remote accommodation services division revenue increased $14.3 million, or 68.1%, to $35.3 million for the year ended December 31, 2015 from $21.0 million for the year ended December 31, 2014. The increase was a result of increased occupancy resulting from the expansion of camp capacity from 498 to 884 rooms in the fourth quarter of 2014 as well as in increase in room nights from 115,258 in 2014 to 251,233 in 2015. While the room nights increased, average revenue per room night declined from $206 in 2014 to $180 in 2015.
Cost of Revenue. Cost of revenue increased $85.2 million, or 44.6%, from $191.1 million, or 73.6% of total revenue, for the year ended December 31, 2014 to $276.3 million, or 76.8% of total revenue, for the year ended December 31, 2015. Cost of revenue by operating division was as follows:
Completion and Production Services. Completion and production services division cost of revenue increased $110.8 million, or 226.1%, from $49.0 million for the year ended December 31, 2014 to $159.8 million for the year ended December 31, 2015, primarily due to our pressure pumping services, which were acquired in connection with our acquisition of Pressure Pumping in November 2014. The increase in cost of revenue associated with our pressure pumping services accounted for $111.1 million, or 100.3%, of the increase. As a percentage of revenue, cost of revenue was 80.4% and 70.0% for the year ended December 31, 2015 and 2014, respectively. The year-over-year increase in cost of revenue as a percentage of revenue was primarily due to the acquisition of Pressure Pumping in November 2014.
Contract Land and Directional Drilling Services. Contract land and directional drilling services division cost of revenue decreased $36.1 million, or 38.6%, from $93.6 million for the year ended December 31, 2014 to $57.5 million for the year ended December 31, 2015, primarily due to a decrease in labor-related costs and a decline in average active rigs from twelve in 2014 to eight in 2015. As a percentage of revenue, drilling cost of revenue was 78.8% and 76.7% for 2015 and 2014, respectively. The increase was primarily due to increased competition for our services, which resulted in a decline in average day rates from $18,900 to $17,900 during the same periods.
Natural Sand Proppant Services. Natural sand proppant services cost of revenue increased $5.1 million, or 13.1%, from $38.8 million for the year ended December 31, 2014 to $43.9 million for the year ended December 31, 2015, primarily due to an increase in our pressure pumping services. As a percentage of revenue, cost of revenue was 83.1% and 83.6% for 2015 and 2014, respectively. The decrease was primarily due to a reduction of labor-related costs.
Remote Accommodation Services. Remote accommodation services division cost of revenue increased $5.4 million, or 55.7%, from $9.7 million for the year ended December 31, 2014 to $15.1 million for the year
60
ended December 31, 2015, primarily due to increases in contracted labor-related costs. As a percentage of revenue, cost of revenue was 42.8% and 46.2% for 2015 and 2014, respectively. As a percentage of revenue, the decrease was primarily due to the increase in revenue associated with an increase in room nights from 115,258 in 2014 to 251,233 in 2015.
Selling, General and Administrative Expenses. Selling, general and administrative expenses represent the costs associated with managing and supporting our operations. These expenses increased $3.5 million, or 20.6%, to $20.5 million for 2015, from $17.0 million for 2014. The increase in expenses was primarily attributable to a $3.1 million increase in bad debt expense.
Depreciation and Amortization. Depreciation and amortization increased $36.8 million, or 103.4%, to $72.4 million for 2015 from $35.6 million for 2014. The increase was primarily attributable to the $101.5 million in property, plant and equipment and $40.7 million in amortizable intangible assets that were acquired in connection with our acquisition of Stingray Pressure Pumping LLC and Stingray Logistics LLC on November 24, 2014. The remainder of the year-over-year increase was attributable to the $111.7 million in property, plant and equipment purchased in 2014 and $26.3 million in property, plant and equipment purchased in 2015.
Impairment of Long-lived Assets. We recorded an impairment of long-lived assets in 2015 of $12.1 million, of which $10.2 million was attributable to various fixed assets and $1.9 million was attributable to the termination of a long-term contract. No impairment of long-lived assets was recorded by us in 2014.
Other (Expense) Income, Net. Other expense, net was $2.2 million in 2015 consisting primarily of the loss on disposal of long-lived assets, compared to $5.7 million in 2014, consisting primarily of charges associated with a proposed public offering in 2014.
Interest Expense. Interest expense increased $0.6 million, or 13.0%, to $5.2 million in 2015, compared to $4.6 million in 2014. The increase in interest expense was attributable to increased average borrowings during 2015 due primarily to $49.8 million in debt that was assumed in our acquisition of Stingray Pressure Pumping LLC and Stingray Logistics LLC on November 24, 2014. The increase in borrowings was offset by the repayment of $70.4 million in debt during 2015.
Income Taxes. We are treated as a pass-through entity for federal income tax and most state income tax purposes. The income tax expense recognized was primarily attributable to Sand Tiger. For 2015, we recognized an income tax benefit of $1.6 million compared to an income tax expense of $7.5 million for 2014. The change was primarily attributable to deferred taxes recorded on income from Sand Tiger in the U.S. for 2014 related to an entity election that required us to disregard previously recorded deferred tax liability. We made an election on entity status in 2015 that allowed the reversal of the deferred taxes in 2015. .
Net Loss. Net loss for the year ended December 31, 2015 was $27.2 million, compared to a net loss of $2.0 million for the year ended December 31, 2014. Net loss by operating division was as follows:
Completion and Production Services. Completion and production services division net loss was $14.0 million for the year ended December 31, 2015, compared to net income of $4.7 million for the year ended December 31, 2014. The decrease in net income was primarily attributable to additional depreciation of long-lived assets and amortization of intangibles in connection with our acquisition of Pressure Pumping in November 2014.
Contract Land and Directional Drilling Services. Contract land and directional drilling services net loss was $30.4 million for the year ended December 31, 2015, compared to net loss of $7.3 million for the year ended December 31, 2014. The increase in net loss was primarily attributable to a decline in the
61
average active number of rigs from 12 during the year ended December 31, 2014 to eight for the year ended December 31, 2015. Additionally, during the year ended December 31, 2015, this operating division had impairments of $8.9 million, while no impairment was recorded in the prior year.
Natural Sand Proppant Services. Natural sand proppant services net income was $0.5 million for the year ended December 31, 2015, compared to net income of $0.3 million for year ended December 31, 2014. The increase in net income was primarily attributable to an increase in our pressure pumping services due to our acquisition of Pressure Pumping in November 2014.
Remote Accommodation Services. Remote accommodation services division net income was $16.7 million for the year ended December 31, 2015, compared to $0.3 million for the year ended December 31, 2014. The increase in net income was primarily attributable to an increase in room nights from 115,258 for year ended December 31, 2014 to 251,233 for year ended December 31, 2015.
Liquidity and Capital Resources
We require capital to fund ongoing operations, including maintenance expenditures on our existing fleet and equipment, organic growth initiatives, investments and acquisitions. Since November 2014, our primary sources of liquidity have been cash on hand, borrowings under our revolving credit facility and cash flows from operations. Our primary use of capital has been for investing in property and equipment used to provide our services. Following the completion of this offering, our primary uses of cash will be for investing in property and equipment used to provide our services. We regularly monitor potential capital sources, including equity and debt financings, in an effort to meet our planned capital expenditures and liquidity requirements. Our future success will be highly dependent on our ability to access outside sources of capital.
As of June 30, 2016, we had an aggregate of $82.3 million in borrowings outstanding under our revolving credit facility, leaving an aggregate of $55.4 million of available borrowing capacity under this facility.
Liquidity and cash flow
The following table sets forth our cash flows for the periods indicated:
| Six Months Ended June 30, |
Year Ended December 31, |
|||||||||||||||
| 2016 | 2015 | 2015 | 2014 | |||||||||||||
| Net cash provided by operating activities |
$ | 11,842,981 | $ | 43,911,916 | $ | 68,392,616 | $ | 8,247,714 | ||||||||
| Net cash provided by (used in) investing activities |
616,558 | (20,253,774) | (24,834,909) | (101,564,915) | ||||||||||||
| Net cash (used in) provided by financing activities |
(14,602,516) | (28,648,742) | (55,931,472) | 103,125,751 | ||||||||||||
| Effect of foreign exchange rate on cash |
6,973 | 188,462 | (226,655) | (2,418,289) | ||||||||||||
|
|
|
|
|
|
|
|
|
|||||||||
| Net change in cash |
$ | (2,136,004) | $ | (4,802,138) | $ | (12,600,420) | $ | 7,390,261 | ||||||||
|
|
|
|
|
|
|
|
|
|||||||||
Operating Activities
Net cash provided by operating activities was $11.8 million for the six months ended June 30, 2016, compared to $43.9 million for the six months ended June 30, 2015. The decrease in operating cash flows was primarily attributable to reduced utilization of our services and products and the fees we charged for such services and products, resulting in the decrease in net cash provided by operating activities.
Net cash provided by operating activities was $68.4 million for the year ended December 31, 2015, compared to $8.2 million for the year ended December 31, 2014. The increase in operating cash flows was
62
primarily attributable to positive gross margin generated by our pressure pumping services as well as cash generated by working capital changes. The cash generated from working capital changes was primarily attributable to the collection of receivables.
Our operating cash flow is sensitive to many variables, the most significant of which are the timing of billing and customer collections and the purchase of sand inventories.
Investing Activities
Net cash provided by investing activities was $0.6 million for the six months ended June 30, 2016, compared to net cash used in investing activities of $20.3 million for the six months ended June 30, 2015. Substantially all cash used in investing activities was used to purchase property and equipment that is utilized to provide our services.
Net cash used in investing activities was $24.8 million for the year ended December 31, 2015, compared to $101.6 million for 2014. Substantially all cash used in investing activities was used to purchase property and equipment that is utilized to provide our services. The following table summarizes our capital expenditures by operating division for the periods indicated:
| Six Months Ended June 30, |
Year Ended December 31, |
|||||||||||||||
| 2016 | 2015 | 2015 | 2014 | |||||||||||||
| Completion and production |
$ | (1,175,371) | $ | (8,139,584) | $ | (10,937,821) | $ | (11,621,751) | ||||||||
| Contract and directional drilling services |
(423,095) | (10,470,054) | (12,650,831) | (85,801,345) | ||||||||||||
| Natural sand proppant production |
(106,252) | (125,578) | (171,202) | (4,587,464) | ||||||||||||
| Remote accommodations |
(844,240) | (1,838,831) | (2,491,821) | (9,679,496) | ||||||||||||
|
|
|
|
|
|
|
|
|
|||||||||
| $ | (2,548,958) | $ | (20,574,047) | $ | (26,251,675) | $ | (111,690,056) | |||||||||
|
|
|
|
|
|
|
|
|
|||||||||
Financing Activities
Net cash used in financing activities was $14.6 million for the six months ended June 30, 2016, compared to $28.6 million for the six months ended June 30, 2015. Substantially all cash used in financing activities was used to pay down net borrowings under our credit facilities. Net cash used in financing activities was $55.9 million for the year ended December 31, 2015, compared to net cash provided by financing activities of $103.1 million for 2014. In 2015, net cash used in financing activities was primarily attributable to net borrowings under our revolving credit facility. In 2014, net cash provided by financing activities was primarily attributable to net borrowings of $53.7 million and capital contributions of $51.8 million.
Working Capital
Our working capital totaled $21.1 million, $25.4 million and $43.1 million at June 30, 2016, December 31, 2015 and December 31, 2014, respectively. Our cash balances totaled $0.9 million, $3.1 million and $15.7 million at June 30, 2016, December 31, 2015 and December 31, 2014, respectively.
Our Revolving Credit Facility
On November 25, 2014, we entered into a $170.0 million revolving credit and security agreement with PNC Capital Markets LLC, as lead arranger, PNC Bank, National Association, as the administrative and collateral agent, and the lenders from time-to-time party thereto. Our revolving credit facility matures on November 25, 2019. Borrowings under our revolving credit facility are secured by our and our subsidiaries’
63
assets. The maximum availability for future borrowings under our revolving credit facility is subject to a borrowing base calculation prepared monthly. Concurrent with our entry into our revolving credit facility, we repaid all of our then existing subordinate debt with the initial advance under our revolving credit facility. Interest is payable monthly at a base rate set by the institution’s commercial lending group plus applicable margin. Additionally, at our request, outstanding balances, are permitted to be converted to LIBOR rate plus applicable margin tranches at set increments of $500,000. The LIBOR rate option allows us to select a more advantageous interest figure from one, two, and three or six month LIBOR futures spot rates, at our selection and based upon management’s opinion of prospective lending rates. The applicable margin for either the base rate or the LIBOR rate option can vary from 1.5% to 3.0%, based upon a calculation of the excess availability of the line as a percentage of the maximum credit limit.
At June 30, 2016, $80.0 million of the total outstanding balance of $82.3 million under the facility was in a one month LIBOR rate option tranche with an interest rate of 3.19%. As of June 30, 2016, we had availability of $55.4 million under our revolving credit facility.
Our revolving credit facility contains various customary affirmative and restrictive covenants. Among the covenants are various financial covenants, including a minimum interest coverage ratio (3.0 to 1.0), maximum leverage ratio (4.0 to 1.0) and minimum availability ($10.0 million). As of June 30, 2016 and December 31, 2015, we were in compliance with all covenants.
Capital Requirements and Sources of Liquidity
As a result of the decline in drilling and completion activity, we reduced our capital expenditures in 2015 and have further reduced our capital expenditures in 2016. During the year ended December 31, 2015, our capital expenditures, excluding acquisitions, were approximately $10.9 million, $12.7 million, $0.2 million and $2.5 million in our completion and production services division, contract land and directional drilling services division, natural sand proppant production services division and remote accommodation services division, respectively, for aggregate capital expenditures of approximately $26.3 million. During the six months ended June 30, 2016, our capital expenditures, excluding acquisitions, were approximately $1.2 million, $0.4 million, $0.1 million and $0.8 million in our completion and production services division, contract land and directional drilling services division, natural sand proppant production services division and remote accommodation services division, respectively, for aggregate capital expenditures of approximately $2.5 million. During 2016, we currently estimate that our aggregate capital expenditures will be approximately $3.7 million, of which approximately $1.6 million has been allocated to our contract land and directional drilling division primarily for upgrades to our rig fleet, approximately $0.5 million has been allocated to our remote accommodations service division primarily for an intersection upgrade, approximately $0.1 million has been allocated to our natural sand proppant services division for a conveyor, and approximately $1.5 million has been allocated to our completion and production services division primarily for upgrades on a coil tubing unit and for pressure pumping equipment. As of June 30, 2016, we have capital purchase commitments outstanding of $1.4 million.
We believe that our operating cash flow and available borrowings under our revolving credit facilities will be sufficient to fund our operations for at least the next twelve months. However, future cash flows are subject to a number of variables, and significant additional capital expenditures will be required to conduct our operations. There can be no assurance that operations and other capital resources will provide cash in sufficient amounts to maintain planned or future levels of capital expenditures. Further, we do not have a specific acquisition budget for 2016 since the timing and size of acquisitions cannot be accurately forecasted. In the event we make one or more acquisitions and the amount of capital required is greater than the amount we have available for acquisitions at that time, we could be required to reduce the expected level of capital expenditures and/or seek additional capital. If we seek additional capital for that or other reasons, we may do so through borrowings under our revolving credit facility, joint venture partnerships, asset sales, offerings of debt and equity securities or other means. We cannot assure you that this additional capital will be available on acceptable terms or at all. If we are
64
unable to obtain funds we need, we may not be able to complete acquisitions that may be favorable to us or finance the capital expenditures necessary to conduct our operations.
Contractual and Commercial Commitments
The following table summarizes our contractual obligations and commercial commitments as of December 31, 2015 (in thousands):
| Total | Less than 1 Year |
1-3 Years | 3-5 Years | More than 5 Years |
||||||||||||||||
| Contractual obligations: |
||||||||||||||||||||
| Long-term debt, including current portion(1) |
$ | 95,000 | $ | - | $ | - | $ | 95,000 | $ | - | ||||||||||
| Interest on long-term debt |
12,368 | 3,173 | 6,346 | 2,849 | - | |||||||||||||||
| Operating lease obligations(2) |
17,043 | 3,958 | 4,727 | 2,924 | 5,434 | |||||||||||||||
| Purchase commitment to sand supplier(3) |
2,800 | 2,800 | - | - | - | |||||||||||||||
|
|
|
|
|
|
|
|
|
|
|
|||||||||||
| $ | 127,211 | $ | 9,931 | $ | 11,073 | $ | 100,773 | $ | 5,434 | |||||||||||
|
|
|
|
|
|
|
|
|
|
|
|||||||||||
| (1) | The long-term debt excludes interest payments on each obligation. |
| (2) | Operating lease obligations relate to real estate, rail cars and other equipment. |
| (3) | The purchase commitment to a sand supplier represents our annual obligation to purchase a minimum amount of sand. If the minimum purchase requirement is not met, the shortfall is settled at the end of the year in cash. |
Critical Accounting Policies and Estimates
The discussion and analysis of our financial condition and results of operations are based upon our combined financial statements, which have been prepared in accordance with accounting principles generally accepted in the United States. Below, we have provided expanded discussion of our more significant accounting policies, estimates and judgments. We believe these accounting policies reflect our more significant estimates and assumptions used in preparation of our financial statements. See Note 2 of our combined financial statements appearing elsewhere in this prospectus for a discussion of additional accounting policies and estimates made by management.
Use of Estimates. In preparing the financial statements, our management makes informed judgments and estimates that affect the reported amounts of assets and liabilities, the disclosure of contingent assets and liabilities at the date of the financial statements and reported amounts of revenues and expenses during the reporting period. Actual results could differ from those estimates. Significant estimates include but are not limited to the allowance for doubtful accounts, reserves for self-insurance, depreciation and amortization of property and equipment, amortization of intangible assets, and future cash flows and fair values used to assess recoverability and impairment of long-lived assets, including goodwill.
Revenue Recognition. We generate revenue from multiple sources within our four operating divisions. In all cases, revenue is recognized when services are performed, collection of the receivables is probable, persuasive evidence of an arrangement exists and the price is fixed and determinable. Services are sold without warranty or the right to return. Taxes assessed on revenue transactions are presented on a net basis and are not included in revenue. The specific revenue sources are outlined as follows:
Completion and Production Services Revenue. Completion and production services are typically provided based upon a purchase order, contract or on a spot market basis. Services are provided on a day rate, contracted or hourly basis, and revenue is recognized as the work progresses. Jobs for these services are typically short-term in nature and range from a few hours to multiple days. Revenue is recognized upon
65
the completion of each day’s work based upon a completed field ticket, which includes the charges for the services performed, mobilization of the equipment to the location and the personnel involved in such services or mobilization. Additional revenue is generated through labor charges and the sale of consumable supplies that are incidental to the service being performed. The labor charges and the use of consumable supplies are reflected on completed field tickets.
Contract Land and Directional Drilling Services Revenue. Contract drilling services are provided under daywork or footage contracts, and revenue is recognized as the work progresses based on the days completed or the feet drilled, as applicable. Mobilization revenue and costs for daywork and footage contracts are recognized over the days of actual drilling. Directional drilling services are provided on a day rate or hourly basis, and revenue is recognized as work progresses. Proceeds from customers for the cost of oilfield downhole rental equipment that is involuntarily damaged or lost in-hole are reflected as revenues.
Remote Accommodation Services. Revenue from remote accommodation services is recognized when rooms are occupied and services have been rendered. Advanced deposits on rooms and special events are deferred until services are provided to the customer.
Natural Sand Proppant Services Revenue. Revenue from the sale of natural sand proppant is recognized according to the terms of title transfer on the sand. For proppant sold free on board plant, revenue is recognized when the sand is shipped. For proppant sold free on board destination, revenue is recognized when the sand reaches the customer specified transload facility or when the sand is loaded into a truck for last mile delivery depending on the specific terms of each sale.
Revenues arising from claims for amounts billed in excess of the contract price or for amounts not included in the original contract are recognized when billed less any allowance for uncollectibility. Revenue from such claims is only recognized if it is probable that the claim will result in additional revenue, the costs for the additional services have been incurred, management believes there is a legal basis for the claim and the amount can be reliably estimated. Revenues from such claims are recorded only to the extent that contract costs relating to the claims have been incurred. Historically, we have not billed any customer for amounts not included in the original contract.
The timing of revenue recognition may differ from contract billing or payment schedules, resulting in revenues that have been earned but not billed (“unbilled revenue”) or amounts that have been billed, but not earned (“deferred revenue”).
Allowance for Doubtful Accounts. We regularly review receivables and provide for estimated losses through an allowance for doubtful accounts. In evaluating the level of established reserves, we make judgments regarding our customers’ ability to make required payments, economic events and other factors. As the financial condition of customers change, circumstances develop or additional information becomes available, adjustments to the allowance for doubtful accounts may be required. In the event we were to determine that a customer may not be able to make required payments, we would increase the allowance through a charge to income in the period in which that determination is made. Uncollectable accounts receivable are periodically charged against the allowance for doubtful accounts once final determination is made of their uncollectibility.
Depreciation and Amortization. In order to depreciate and amortize our property and equipment, we estimate useful lives, attrition factors and salvage values of these items. Our estimates may be affected by such factors as changing market conditions, technological advances in industry or changes in regulations governing the industry.
Impairment of Long-Lived Assets. Long-lived assets are reviewed for impairment when events or changes in circumstances indicate that the carrying amount of such assets may not be recoverable. Recoverability of such assets is evaluated by measuring the carrying amount of the assets against the estimated undiscounted future cash
66
flows associated with the assets. If such evaluations indicate that the future undiscounted cash flow from the assets is not sufficient to recover the carrying value of such assets, the assets are adjusted to their estimated fair values.
Goodwill. Goodwill is tested for impairment annually, or more frequently if events or changes in circumstances indicate that goodwill might be impaired. The impairment test is a two-step process. First, the fair value of each reporting unit is compared to its carrying value to determine whether an indication of impairment exists. If impairment is indicated, then the implied value of the reporting unit’s goodwill is determined by allocating the unit’s fair value to its assets and liabilities as if the reporting unit had been acquired in a business combination. The fair value of the reporting unit is determined using the discounted cash flow approach, excluding interest. The impairment for goodwill is measure as the excess of its carrying value over its implied value.
Income Taxes. Mammoth Partners and each of its subsidiaries, except Sand Tiger, is treated as a pass-through entity for federal income tax and most state income tax purposes. Accordingly, income taxes on net earnings are payable by the stockholders, members or partners and are not reflected in the historical financial statements. Sand Tiger is subject to corporate income taxes and they are provided in the financial statements based upon Financial Accounting Standards Board, Accounting Standard Codification 740 Income Taxes. As such, deferred tax assets and liabilities are recognized for the future tax consequences attributable to differences between the financial statement carrying amounts of existing assets and liabilities and their respective tax bases. Deferred tax assets and liabilities are measured using statutory tax rates expected to apply to taxable income in the years in which those temporary differences are expected to be recovered or settled. The effect of deferred tax assets and liabilities as a result of a change in tax rate is recognized in the period that includes the statutory enactment date. A valuation allowance for deferred tax assets is recognized when it is more likely than not that the benefit of deferred tax assets will not be realized.
Emerging Growth Company
The Jumpstart Our Business Startups Act of 2012 permits an “emerging growth company” like us to take advantage of an extended transition period to comply with new or revised accounting standards applicable to public companies. We are choosing to “opt out” of this provision and, as a result, we will comply with new or revised accounting standards as required when they are adopted. This decision to opt out of the extended transition period is irrevocable.
Internal Controls and Procedures
We are not currently required to comply with the SEC’s rules implementing Section 404 of the Sarbanes Oxley Act of 2002, and are therefore not required to make a formal assessment of the effectiveness of our internal control over financial reporting for that purpose. Upon becoming a public company, we will be required to comply with the SEC’s rules implementing Section 302 of the Sarbanes-Oxley Act of 2002, which will require our management to certify financial and other information in our quarterly and annual reports and provide an annual management report on the effectiveness of our internal control over financial reporting. We will not be required to make our first assessment of our internal control over financial reporting under Section 404 until the year following our first annual report required to be filed with the SEC. To comply with the requirements of being a public company, we will need to implement additional financial and management controls, reporting systems and procedures and hire additional accounting, finance and legal staff.
Further, our independent registered public accounting firm is not yet required to formally attest to the effectiveness of our internal controls over financial reporting, and will not be required to do so for as long as we are an “emerging growth company” pursuant to the provisions of the Jumpstart Our Business Startups Act of 2012 or as long as we are a non-accelerated filer. See “Prospectus Summary—Emerging Growth Company.” Please also see “Risk Factors—Risks Inherent to this Offering and Our Common Stock—For so long as we are an
67
‘emerging growth company’ we will not be required to comply with certain disclosure requirements that are applicable to other public companies and we cannot be certain if the reduced disclosure requirements applicable to emerging growth companies will make our common stock less attractive to investors.”
Inflation
Inflation in the United States has been relatively low in recent years and did not have a material impact on our results of operations for the years ended 2015 and 2014 or the six-month period ended June 30, 2016. Although the impact of inflation has been insignificant in recent years, it is still a factor in the United States economy and we tend to experience inflationary pressure on the cost of oilfield services and equipment as increasing oil and gas prices increase drilling activity in our areas of operations.
Quantitative and Qualitative Disclosure about Market Risks
The demand, pricing and terms for oil and gas services provided by us are largely dependent upon the level of activity for the U.S. oil and natural gas industry. Industry conditions are influenced by numerous factors over which we have no control, including, but not limited to: the supply of and demand for oil and natural gas; the level of prices, and expectations about future prices of oil and natural gas; the cost of exploring for, developing, producing and delivering oil and natural gas; the expected rates of declining current production; the discovery rates of new oil and natural gas reserves; available pipeline and other transportation capacity; weather conditions; domestic and worldwide economic conditions; political instability in oil-producing countries; environmental regulations; technical advances affecting energy consumption; the price and availability of alternative fuels; the ability of oil and natural gas producers to raise equity capital and debt financing; and merger and divestiture activity among oil and natural gas producers.
The level of activity in the U.S. oil and natural gas exploration and production industry is volatile. Expected trends in oil and natural gas production activities may not continue and demand for our services may not reflect the level of activity in the industry. Any prolonged substantial reduction in oil and natural gas prices would likely affect oil and natural gas production levels and therefore affect demand for our services. A material decline in oil and natural gas prices or U.S. activity levels could have a material adverse effect on our business, financial condition, results of operations and cash flows. Recently, demand for our services has been strong and we are continuing our past practice of committing our equipment on a short-term or day-to-day basis.
Interest Rate Risk
We had a cash and cash equivalents balance of $0.9 million at June 30, 2016. We do not enter into investments for trading or speculative purposes. We do not believe that we have any material exposure to changes in the fair value of these investments as a result of changes in interest rates. Declines in interest rates, however, will reduce future income.
We had $82.3 million outstanding under our revolving credit facility at June 30, 2016, with a weighted average interest rate of 3.3%. A 1% increase or decrease in the interest rate would increase or decrease interest expense by approximately $0.8 million per year. We do not currently hedge our interest rate exposure.
Foreign Currency Risk
Our remote accommodation businesses generate revenue and incur expenses that are denominated in the Canadian dollar. These transactions could be materially affected by currency fluctuations. Changes in currency exchange rates could adversely affect our consolidated results of operations or financial position. We also maintain cash balances denominated in the Canadian dollar. At June 30, 2016, we had $0.5 million of cash in Canadian accounts. A 10% increase in the strength of the Canadian dollar versus the U.S. dollar would have resulted in an increase in pre-tax income of approximately $0.6 million as of June 30, 2016. Conversely, a
68
corresponding decrease in the strength of the Canadian dollar would have resulted in a comparable decrease in pre-tax income. We have not hedged our exposure to changes in foreign currency exchange rates and, as a result, could incur unanticipated translation gains and losses.
Seasonality
We provide completion and production services primarily in the Utica, Permian Basin, Eagle Ford, Marcellus, Granite Wash, Cana Woodford and Cleveland sand resource plays located in the continental U.S. We also provide remote accommodation services in the oil sands in Alberta, Canada. We serve these markets through our facilities and service centers that are strategically located to serve resource plays in Ohio, Oklahoma, Wisconsin, Minnesota and Alberta, Canada. For the year ended December 31, 2015 and the six months ended June 30, 2016, we generated approximately 85% and 72%, respectively, of our revenue from our operations in Ohio, Wisconsin, Minnesota, Pennsylvania, West Virginia and Canada where weather conditions may be severe. As a result, our operations may be limited or disrupted, particularly during winter and spring months, in these geographic regions, which would have a material adverse effect on our financial condition and results of operations. Our operations in Oklahoma and Texas are generally not affected by seasonal weather conditions.
Off-Balance Sheet Arrangements
We currently have no off-balance sheet arrangements.
69
General
Overview
We are an integrated, growth-oriented oilfield services company providing completion and production services, contract and directional drilling services and remote accommodation services primarily to companies engaged in the exploration and development of North American onshore unconventional sands and shale oil and natural gas reserves, commonly referred to as “unconventional resources.”
“Unconventional resources” references the different manner by which they are exploited as compared to the extraction of conventional resources. In unconventional drilling, the wellbore is generally drilled to specific objectives within narrow parameters, often across long, lateral intervals within narrow horizontal formations offering greater contact area with the producing formation. Typically, the well is then hydraulically fractured at multiple stages to optimize production. Our completion and production services division provides pressure pumping services, pressure control services, flowback services and equipment rental. Our natural sand proppant services division sells, distributes and is capable of producing proppant for hydraulic fracturing. Our contract land and directional drilling services division provides drilling rigs and crews for operators as well as rental equipment, such as mud motors and operational tools, for both vertical and horizontal drilling. Our remote accommodation division provides housing, kitchen and dining, and recreational service facilities for oilfield workers located in remote areas away from readily available lodging. We believe that these services play a critical role in increasing the ultimate recovery and present value of production streams from unconventional resources. Our complementary suite of drilling and completion and production related services provides us with the opportunity to cross-sell our services and expand our customer base and geographic positioning.
Our facilities and service centers are strategically located in Ohio, Oklahoma, Wisconsin, Minnesota, West Virginia, Texas and Alberta, Canada primarily to serve the following resource plays:
| • | The Utica Shale in Eastern Ohio; |
| • | The Permian Basin in West Texas; |
| • | The Appalachian Basin in the Northeast; |
| • | The Arkoma Basin in Arkansas and Oklahoma; |
| • | The Anadarko Basin in Oklahoma; |
| • | The Marcellus Shale in West Virginia and Pennsylvania; |
| • | The Granite Wash and Mississippi Shale in Oklahoma and Texas; |
| • | The Cana Woodford and Woodford Shales and the Cleveland Sand in Oklahoma; |
| • | The Eagle Ford Shale in Texas; and |
| • | The oil sands in Alberta, Canada. |
Our operational division heads have an average of over 34 years of oilfield service experience and bring valuable basin-level expertise and long-term customer relationships to our business. We provide our completion and production and contract and directional drilling services to a diversified range of both public and private independent producers. Our top five customers for the year ended December 31, 2015, representing 71% of our revenue, were Gulfport, EQT Production Company, Oil Sands Limited, RSP Permian LLC and Bantrel Co. Our top five customers for the six months ended June 30, 2016, representing 80% of our revenue, were Gulfport, Rice Energy Inc., Oil Sands Limited, Hilcorp Energy Company and Taylor Frac LLC.
70
Our Services
We manage our business through four operating divisions: completion and production services, natural sand proppant services, contract and directional drilling services and remote accommodation services.
Completion and Production Services
Our completion and production business provides pressure pumping, pressure control services, flowback services and equipment rental.
Pressure Pumping. Our primary service offering is providing pressure pumping services, also known as hydraulic fracturing, to exploration and production companies. These services are intended to optimize hydrocarbon flow paths during the completion phase of horizontal shale wellbores. Currently, we provide pressure pumping services in the Utica Shale of Eastern Ohio. Two of our fleets, which are currently providing services in the Utica Shale, operate under a long-term contract expiring in September 2018. Our pressure pumping services include the following:
| • | Hydraulic Fracturing. We provide high-pressure hydraulic fracturing services. Fracturing services are performed to enhance the production of oil and natural gas from formations having low permeability such that the flow of hydrocarbons is restricted. We have significant expertise in multi-stage fracturing of horizontal oil- and natural gas-producing wells in shale and other unconventional geological formations. |
The fracturing process consists of pumping a fracturing fluid into a well at sufficient pressure to fracture the formation. Materials known as proppants, in our case primarily sand or ceramic beads, are suspended in the fracturing fluid and are pumped into the fracture to prop it open. The fracturing fluid is designed to “break,” or loosen viscosity, and be forced out of the formation by its pressure, leaving the proppants suspended in the fractures created, thereby increasing the mobility of the hydrocarbons. As a result of the fracturing process, production rates are usually enhanced substantially, thus increasing the rate of return for the operator.
We own and operate fleets of mobile hydraulic fracturing units and other auxiliary heavy equipment to perform fracturing services. Our hydraulic fracturing units consist primarily of a high pressure hydraulic pump, a diesel engine, a transmission and various hoses, valves, tanks and other supporting equipment that are typically mounted to a flat-bed trailer. As of August 1, 2016, we had grown our pressure pumping business to three fleets consisting of an aggregate 64 high-pressure fracturing units capable of delivering a total of 128,000 horsepower. We refer to the group of fracturing units, other equipment and vehicles necessary to perform a typical fracturing job as a “fleet” and the personnel assigned to each fleet as a “crew.” In areas in which we operate on a 24-hour-per-day basis, we typically staff three crews per fleet. All of our fracturing units and high pressure pumps are manufactured to our specifications to enhance the performance and durability of our equipment and meet our customers’ needs.
Each hydraulic fracturing fleet includes a mobile, on-site control center that monitors pressures, rates and volumes, as applicable. From there, our field-level managers supervise the job-site by radio. Each control center is equipped with high bandwidth satellite hardware that provides continuous upload and download of job telemetry data. The data is delivered on a real-time basis to on-site job personnel, the operator and an assigned coordinator at our headquarters for display in both digital and graphical form. In October 2016, we expect to commence on-site refueling of our fracturing units through our subsidiary Silverback in our effort to further reduce costs.
An important element of fracturing services is determining the proper fracturing fluid, proppants and injection program to maximize results. In virtually all of our hydraulic fracturing jobs, our customers
71
specify the composition of the fracturing fluid to be used. The fracturing fluid may contain hazardous substances, such as hydrochloric acid and certain petrochemicals. Our customers are responsible for the disposal of the fracturing fluid that flows back out of the well as waste water. The customers remove the water from the well using a controlled flow-back process, and we are not involved in that process or in the disposal of the fluid.
Pressure Control. Our pressure control services consist of coiled tubing, nitrogen and fluid pumping services. Our pressure control services equipment is designed to support drilling activities in unconventional resource plays with the ability to operate under high pressures without having to delay or cease production during completion operations. Ceasing or suppressing production during the completion phase of an unconventional well could result in formation damage impacting the overall recovery of reserves. Our pressure control services help operators minimize the risk of such damage during completion activities. Currently, we provide pressure control services in the Eagle Ford Shale in South Texas and the Permian Basin in West Texas. Our pressure control services include the following:
| • | Coiled Tubing Services. Coiled tubing services involve injecting coiled tubing into wells to perform various well-servicing and workover operations. Coiled tubing is a flexible steel pipe with a diameter of typically less than three inches and manufactured in continuous lengths of thousands of feet. It is wound or coiled on a truck-mounted reel for onshore applications. Due to its small diameter, coiled tubing can be inserted into existing production tubing and used to perform a variety of services to enhance the flow of oil or natural gas without using a larger, more costly workover rig. The principal advantages of using coiled tubing in a workover include the ability to (i) continue production from the well without interruption, thus reducing the risk of formation damage, (ii) move continuous coiled tubing in and out of a well significantly faster than conventional pipe in the case of a workover rig, which must be jointed and unjointed, (iii) direct fluids into a wellbore with more precision, allowing for improved stimulation fluid placement, (iv) provide a source of energy to power a downhole mud motor or manipulate down-hole tools and (v) enhance access to remote fields due to the smaller size and mobility of a coiled tubing unit. As of August 1, 2016, we had three coiled tubing units capable of running over 22,000 feet of two inch coil rated at 15,000 pounds per square inch, or psi, and three coiled tubing units capable of running over 20,000 feet of two and three eighths inch coil rated at 15 pounds per square inch, or psi, in service. We believe these units are well suited for the performance requirements of the unconventional resource markets we serve. The average age of these units was less than three years at August 1, 2016. |
| • | Nitrogen Services. Nitrogen services involve the use of nitrogen, an inert gas, in various pressure pumping operations. When provided as a stand-alone service, nitrogen is used in displacing fluids in various oilfield applications. As of August 1, 2016, we had a total of four nitrogen pumping units capable of pumping at a rate of up to 3,000 standard cubic feet per minute with pressures up to 10,000 psi. Pumping at these rates and pressures is typically required for the unconventional oil and natural gas resource plays we serve. The average age of these units was less than four years at August 1, 2016. |
| • | Fluid Pumping Services. Fluid pumping services consist of maintaining well pressure, pumping down wireline tools, assisting coiled tubing units and the removal of fluids and solids from the wellbore for clean-out operations. As of August 1, 2016, we had five fluid pumping units with an average age of less than three years. Of these, all five were coiled tubing double pump units capable of output of up to eight barrels per minute, and are rated to a maximum of 15,000 psi service. |
Flowback. Our flowback services consist of production testing, solids control, hydrostatic testing and torque services. Flowback involves the process of allowing fluids to flow from the well following a treatment, either in preparation for an impending phase of treatment or to return the well to production. Our flowback
72
equipment consists of manifolds, accumulators, valves, flare stacks and other associated equipment that combine to form up to a total of five well-testing spreads. We provide flowback services in the Appalachian Basin, the Haynesville Shale and mid-continent markets.
| • | Production Testing. Production testing focuses on testing production potential. Key measurements are recorded to determine activity both above and below ground. Production testing and the knowledge it provides help our customers determine where they can more efficiently deploy capital. As of August 1, 2016, we had five production testing packages. |
| • | Solids Control. Solids control services provide prepared drilling fluids for drilling rigs with equipment such as sand separators and plug catchers. These services reduce costs throughout the entire drilling process. As of August 1, 2016, we had ten solids control packages. |
| • | Hydrostatic Testing. Hydrostatic testing is a procedure in which pressure vessels, such as pipelines, are tested for damage or leaks. This method of testing helps maintain safety standards and increases the durability of the pipeline. We employ hydrostatic testing at industry standards and to a customer’s desired specifications and configuration. As of August 1, 2016, we had two hydrostatic testing packages. |
| • | Torque Services. Torque refers to the force applied to a rotary device to make it rotate. We offer a comprehensive range of torque services, offering a customer the dual benefit of reducing costs on the rig as well as reducing hazards for both personnel and equipment. We had five torque service packages as of August 1, 2016. |
Equipment Rentals. Our equipment rental services provide a wide range of oilfield related equipment used in flowback and hydraulic fracturing services. Our equipment rentals consist of light plants and other oilfield related equipment. We provide equipment rental services in the Appalachian Basin and mid-continent markets.
Master Services Agreements. We contract with most of our completion and production customers under MSAs. Generally, under our MSAs, including those relating to our hydraulic fracturing services, we assume responsibility for, including control and removal of, pollution or contamination which originates above surface and originates from our equipment or services. However, our customer assumes responsibility for, including control and removal of, all other pollution or contamination which may occur during operations, including that which may result from seepage or any other uncontrolled flow of drilling fluids. We may have liability in such cases if we are negligent or commit willful acts which cause such events. Generally, our customers also agree to indemnify us against claims arising from their employees’ personal injury or death to the extent that, in the case of our hydraulic fracturing operations, their employees are injured or their properties are damaged by such operations, unless resulting from our gross negligence or willful misconduct. Similarly, we generally agree to indemnify our customers for liabilities arising from personal injury to or death of any of our employees, unless resulting from gross negligence or willful misconduct of the customer. In addition, our customers generally agree to indemnify us for loss or destruction of customer-owned property or equipment and in turn, we agree to indemnify our customers for loss or destruction of property or equipment we own. Losses due to catastrophic events, such as blowouts, are generally the responsibility of the customer. However, despite this general allocation of risk, we might not succeed in enforcing such contractual allocation of risk, might incur an unforeseen liability falling outside the scope of such allocation or may be required to enter into an MSA with terms that vary from the above allocations of risk. As a result, we may incur substantial losses which could materially and adversely affect our financial condition and results of operation.
Natural Sand Proppant Services
In our natural sand proppant business, we currently buy processed sand from suppliers on the spot market and resell that sand. Natural sand proppant, also known as frac sand, is the most widely used type of proppant
73
due to its broad applicability in unconventional oil and natural gas wells and its cost advantage relative to other proppants. Natural frac sand may be used as proppant in all but the highest pressure and temperature drilling environments and is being employed in nearly all major U.S. unconventional oil and natural gas producing basins, including those in which we operate.
We also have the ability to purchase raw sand under a fixed-price contract with one supplier, process it into premium monocrystalline sand (also known as frac sand), a specialized mineral that is used as a proppant at our indoor sand processing plant located in Pierce County, Wisconsin and sell it to our customers for use in their hydraulic fracturing operations to enhance recovery rates from unconventional wells. Our sand processing plant is capable of producing a range of frac sand sizes for use in all major North American shale basins, including a majority of the standard proppant sizes as defined by the ISO/API 13503-2 specifications. These grain sizes can be customized to meet the demands of our customers with respect to a specific well. Our supply of Jordan substrate exhibits the physical properties necessary to withstand the completion and production environments of the wells in these shale basins. Although our indoor processing plant is designed for year-round continuous wet and dry plant operation capable of producing a wide variety of frac sand products based on the needs of our customers, this plant is not currently producing sand as a result of the decline in commodity pricing and the resulting decrease in completion activity. Subject to market conditions and other factors, we currently anticipate returning this plant to operation, with minimal capital expenditures, as early as the fourth quarter of 2017.
We also provide logistics solutions to facilitate delivery of our frac sand products to our customers. Almost all of our frac sand products are shipped by rail to our customers in the Utica Shale and the Montney Shale in British Columbia and Alberta, Canada. Our logistics capabilities in this regard are important to our customers, who focus on both the reliability and flexibility of product delivery. Because our customers generally find it impractical to store frac sand in large quantities near their job sites, they typically prefer product to be delivered where and as needed, which requires predictable and efficient loading and shipping capabilities. We contract with third party providers to transport our frac sand products to railroad facilities for delivery to our customers. We currently lease or have access to origin transloading facilities on the Canadian National Railway Company (CN), Union Pacific (UP), Burlington Northern Santa Fe (BNSF) and the Canadian Pacific (CP) rail systems and use an in-house railcar fleet that we lease from various third parties to deliver our frac sand products to our customers. Origin transloading facilities on multiple railways allow us to provide predictable and efficient loading and shipping of our frac sand products. We also utilize a destination transloading facility in Yorkville, Ohio, which is operated by one of our affiliates, to serve the Utica Shale, and utilize destination transloading facilities located in other North American resource plays, including the Montney Shale, to meet our customers’ delivery needs.
Contract and Directional Drilling Services
Our contract and directional drilling business provides contract drilling and directional drilling services.
Contract Drilling. As part of our contract drilling services, we provide both vertical and horizontal drilling services to our customers. Currently, we perform our contract drilling services in the Permian Basin of West Texas. Our top five customers for our contract drilling services for the year ended December 31, 2015 were RSP Permian, J Cleo Thompson, RKI Exploration and Production, and Itasca Energy. For the six months ended June 30, 2016, the top five customers for our contract drilling services were Surge Energy America, RP Operating, RSP Permian, PT Petroleum and EI Toro Resources.
A majority of the wells we drill for our customers are drilled in unconventional basins or resource plays. These plays are generally characterized by complex geologic formations that often require higher horsepower, premium rigs and experienced crews to reach targeted depths. As of August 1, 2016, we owned 13 land drilling rigs, ranging from 800 to 1,500 horsepower, nine of which are specifically designed for drilling horizontal and directional wells, which continue to increase as a percentage of total wells drilled in North America and are frequently utilized in unconventional resource plays. As of August 1, 2016, four of our 13 drilling rigs were
74
operating under term contracts with a term of more than one well or a stated period of time. To facilitate the provision of our contract drilling services, as of August 1, 2016, we also owned 32 trucks specifically tailored to move rigs and two cranes to assist us in moving rigs in the Permian Basin.
A land drilling rig generally consists of engines, a hoisting system, a rotating system, a drawworks, a mast, pumps and related equipment to circulate the drilling fluid under various pressures, blowout preventers, drill string and related equipment. The engines power the different pieces of equipment, including a rotary table or top drive that turns the drill pipe, or drill string, causing the drill bit to bore through the subsurface rock layers. Drilling rigs use long strings of drill pipe and drill collars to drill wells. Drilling rigs are also used to set heavy strings of large-diameter pipe, or casing, inside the borehole. Because the total weight of the drill string and the casing can exceed 500,000 pounds, drilling rigs require significant hoisting and braking capacities. Generally, a drilling rig’s hoisting system is made up of a mast, or derrick, a drilling line, a traveling block and hook assembly and ancillary equipment that attaches to the rotating system, a mechanism known as the drawworks. The drawworks mechanism consists of a revolving drum, around which the drilling line is wound, and a series of shafts, clutches and chain and gear drives for generating speed changes and reverse motion. The drawworks also houses the main brake, which has the capacity to stop and sustain the weights used in the drilling process. When heavy loads are being lowered, a hydromatic or electric auxiliary brake assists the main brake to absorb the great amount of energy developed by the mass of the traveling block, hook assembly, drill pipe, drill collars and drill bit or casing being lowered into the well.
The rotating equipment from top to bottom consists of a swivel, the kelly bushing, the kelly, the rotary table, drill pipe, drill collars and the drill bit. We refer to the equipment between the swivel and the drill bit as the drill stem. The swivel assembly sustains the weight of the drill stem, permits its rotation and affords a rotating pressure seal and passageway for circulating drilling fluid into the top of the drill string. The swivel also has a large handle that fits inside the hook assembly at the bottom of the traveling block. Drilling fluid enters the drill stem through a hose, called the rotary hose, attached to the side of the swivel. The kelly is a triangular, square or hexagonal piece of pipe, usually 40 feet long, that transmits torque from the rotary table to the drill stem and permits its vertical movement as it is lowered into the hole. The bottom end of the kelly fits inside a corresponding triangular, square or hexagonal opening in a device called the kelly bushing. The kelly bushing, in turn, fits into a part of the rotary table called the master bushing. As the master bushing rotates, the kelly bushing also rotates, turning the kelly, which rotates the drill pipe and thus the drill bit. Drilling fluid is pumped through the kelly on its way to the bottom. The rotary table, equipped with its master bushing and kelly bushing, supplies the necessary torque to turn the drill stem. The drill pipe and drill collars are both steel tubes through which drilling fluid can be pumped. Drill pipe comes in 30-foot sections, or joints, with threaded sections on each end. Drill collars are heavier than drill pipe and are also threaded on the ends. Collars are used on the bottom of the drill stem to apply weight to the drill bit. At the end of the drill stem is the bit, which chews up the formation rock and dislodges it so that drilling fluid can circulate the fragmented material back up to the surface where the circulating system filters it out of the fluid.
Drilling fluid, often called drilling mud, is a mixture of clays, chemicals and water or oil, which is carefully formulated for the particular well being drilled. Bulk storage of drilling fluid materials, the pumps and the mud-mixing equipment are placed at the start of the circulating system. Working mud pits and reserve storage are at the other end of the system. Between these two points the circulating system includes auxiliary equipment for drilling fluid maintenance and equipment for well pressure control. Within the system, the drilling mud is typically routed from the mud pits to the mud pump and from the mud pump through a standpipe and the rotary hose to the drill stem. The drilling mud travels down the drill stem to the bit, up the annular space between the drill stem and the borehole and through the blowout preventer stack to the return flow line. It then travels to a shale shaker for removal of rock cuttings, and then back to the mud pits, which are usually steel tanks. The reserve pits, usually one or two fairly shallow excavations, are used for waste material and excess water around the location.
There are numerous factors that differentiate drilling rigs, including their power generation systems, horsepower, maximum drilling depth and horizontal drilling capabilities. The actual drilling depth capability of a
75
rig may be less than or more than its rated depth capability due to numerous factors, including the size, weight and amount of the drill pipe on the rig. The intended well depth and the drill site conditions determine the amount of drill pipe and other equipment needed to drill a well.
Our drilling rigs have rated maximum depth capabilities ranging from 12,500 feet to 20,000 feet. Of these drilling rigs, seven are electric rigs and six are mechanical rigs. An electric rig differs from a mechanical rig in that the electric rig converts the power from its generators (which in the case of mechanical rigs, power the rig directly) into electricity to power the rig. Depth and complexity of the well and drill site conditions are the principal factors in determining the specifications of the rig selected for a particular job. Power requirements for drilling jobs may vary considerably, but most of our mechanical drilling rigs employ six engines to generate between 800 and 1,500 horsepower, depending on well depth and rig design. Most drilling rigs capable of drilling in deep formations drill to measured depths greater than 10,000 to 18,000 feet. Generally, land rigs operate with four crews of five people and two tool pushers, or rig managers, rotating on a weekly or bi-weekly schedule.
We believe that our drilling rigs and other related equipment are in good operating condition. Our employees perform periodic maintenance and minor repair work on our drilling rigs.
We obtain our contracts for drilling oil and natural gas wells either through competitive bidding or through direct negotiations with customers. We typically enter into drilling contracts that provide for compensation on a daywork basis. Occasionally, we enter into drilling contracts that provide for compensation on a footage basis, however, a majority of such footage drilling contracts also provide for daywork rates for work outside core drilling activities contemplated by such footage contracts and under certain other circumstances. We have not historically entered into turnkey contracts; however, we may decide to enter into such contracts in the future. It is also possible that we may acquire such contracts in connection with future acquisitions of drilling assets. Contract terms we offer generally depend on the complexity and risk of operations, the on-site drilling conditions, the type of equipment used, the anticipated duration of the work to be performed and market conditions. As of July 1, 2016, four of our 13 drilling rigs were operating under term contracts that provide for a take-or-pay model where customers cannot terminate contracts without paying the full amount remaining and three were operating under contracts that allow the customer to terminate on 30 days’ notice, upon payment of an agreed upon fee.
Daywork Contracts. Under daywork drilling contracts, we provide equipment and labor and perform services under the direction, supervision and control of our customers. We are paid a specified operating daywork rate from the time the drilling unit is rigged up at the drilling location and is ready to commence operations. Additionally, the daywork drilling contracts typically provide for fees and/or a daywork rates for mobilization, demobilization, moving, standby time and for any continuous period that normal operations are suspended or cannot be carried on because of force majeure conditions. The daywork drilling contracts also generally provide that the customer has the right to designate the points at which casing will be set and the manner of setting, cementing and testing. Such specifications include hole size, casing size, weight, grade and approximate setting depth. Furthermore, the daywork drilling contracts specify the equipment, materials and services to be separately furnished by us and our customer. Under these contracts, liability is typically allocated so that our customer is solely responsible for the following: (i) damage to our surface equipment as a result of certain corrosive elements; (ii) damage to customer’s equipment; (iii) damage to our in-hole equipment; (iv) damage or loss to the hole; (v) damage to the underground; and (vi) costs and damages associated with a wild well. We remain responsible for any damage to our surface equipment (except for damage resulting from the presence of certain corrosive elements) and for pollution or contamination from spills of materials that originate above the surface, are wholly in our control and are directly associated with our equipment. Daywork drilling contracts generally allow the customer to terminate the contract prior to drilling to a specified depth. This right, however, is generally subject to early termination compensation, the amount of which depends on when the termination occurs.
76
Footage Contracts. Under footage contracts, the contractor is typically paid a fixed amount for each foot drilled, regardless of the time required or the problems encountered in drilling the well. A majority of these types of drilling contracts, however, contain both footage and daywork basis provisions, the applicability of which typically depends on the depth of drilling and/or the type of services being performed. For instance, when drilling occurs below a specified drilling depth or when work is considered outside the scope of the footage basis, which we refer to as core drilling, then daywork contract terms apply similar to those described above. Otherwise, the footage contract terms apply. These include a footage rate price that is a specific dollar amount per linear foot of hole drilled within the contract footage depth. Also, under the footage contract terms, we assume more responsibility for base drilling activities compared to daywork drilling. For instance, in addition to assuming responsibility for damage to our surface equipment and damage caused by certain pollution and contamination, we are responsible for the following: (i) damage to our in-hole equipment; (ii) damage to the hole that is attributable to our performance; and (iii) any costs or expenditures associated with drilling a new hole after such damage. Our customers remain responsible for any loss to their equipment, for any damage to a hole caused by them and for any underground damage. As with contracts for daywork drilling, footage drilling contracts generally allow the customer to terminate the contract before drilling to a specified depth. This right, however, is generally subject to early termination compensation, the amount of which depends on when the termination occurs.
Because we assume higher risk in a footage drilling contract, we typically pay more of the out-of-pocket costs associated with such contracts as compared to daywork contracts. We endeavor to manage these additional risks through the use of our engineering expertise and bid the footage contracts accordingly. We typically maintain insurance coverage against some, but not all, drilling hazards. However, the occurrence of uninsured or under-insured losses or operating cost overruns on our footage jobs could have a negative impact on our profitability. While we have historically entered into few footage contracts, we may enter into more such arrangements in the future to the extent warranted by market conditions.
Turnkey Contracts. Turnkey contracts typically provide for a drilling company to drill a well for a customer to a specified depth and under specified conditions for a fixed price, regardless of the time required or the problems encountered in drilling the well. The drilling company would provide technical expertise and engineering services, as well as most of the equipment and drilling supplies required to drill the well. The drilling company may subcontract for related services, such as the provision of casing crews, cementing and well logging. Under typical turnkey drilling arrangements, a drilling company would not receive progress payments and would be paid by its customer only after it had performed the terms of the drilling contract in full.
The risks to the drilling company under a turnkey contract are substantially greater than those under a daywork basis. This is primarily because under a turnkey contract, the drilling company assumes most of the risks associated with drilling operations generally assumed by the operator in a daywork contract, including the risk of blowout, loss of hole, stuck drill pipe, machinery breakdowns, abnormal drilling conditions and risks associated with subcontractors’ services, supplies, cost escalations and personnel.
Directional Drilling. Our directional drilling services provide for the efficient drilling and production of oil and natural gas from unconventional resource plays. Our directional drilling equipment includes mud motors used to propel drill bits and kits for MWD and EM technology. MWD kits are down-hole tools that provide real-time measurements of the location and orientation of the bottom-hole assembly, which is necessary to adjust the drilling process and guide the wellbore to a specific target. This technology, coupled with our complementary services, allows our customers to drill wellbores to specific objectives within narrow location parameters within target horizons. The evolution of unconventional resource reserve recovery has increased the need for the precise placement of a wellbore. Wellbores often travel across long-lateral intervals within narrow formations as thin as ten feet. Our personnel are involved in all aspects of a well from the initial planning of a customer’s drilling program to the management and execution of the horizontal or directional drilling operation. Currently, we perform our directional drilling services in the Appalachian Basin, Anadarko Basin, Arkoma Basin, and Permian Basin. For the year ended December 31, 2015, our top five customers for our directional drilling services were
77
Gulfport, Le Norman Operating LLC, Jay Bee Oil & Gas, Crown Energy Company and Energen Resources. For the six months ended June 30, 2016, our top five customers for our directional drilling services were Gulfport, Le Norman Operating LLC, El Toro Resources LLC, Halliburton Energy Services and Panther Energy.
As of August 1, 2016, we owned seven MWD kits and three EM kits used in vertical, horizontal and directional drilling applications, 52 mud motors, ten air motors and an inventory of related parts and equipment. As of August 1, 2016, we employed seven directional drillers with significant industry experience to implement our services.
Remote Accommodation Services
Our remote accommodations business provide housing, kitchen and dining, and recreational service facilities for oilfield workers located in remote areas away from readily available lodging. We provide a turnkey solution for our customers’ accommodation needs. These modular camps, when assembled together, form large dormitories, with kitchen/dining facilities and recreation areas. These camps are operated as “all inclusive,” where meals are prepared and provided for the guests. The primary revenue source for these camps is lodging fees. In 2013, we expanded our remote accommodation services business after being awarded a long-term contract by an unrelated third party. We also have an agreement with an affiliate pursuant to which we provide remote accommodation services on an on-going basis. See “Certain Relationships and Related Party Transactions.” As of August 1, 2016, we had a capacity of 1,008 remote accommodation rooms, 880 of which are located at Sand Tiger Lodge, our camp in northern Alberta, Canada, and 128 of which are available to be leased as rental equipment to a third party.
Our Industry
The oil and natural gas industry has traditionally been volatile and is influenced by a combination of long-term, short-term and cyclical trends, including the domestic and international supply and demand for oil and natural gas, current and expected future prices for oil and natural gas and the perceived stability and sustainability of those prices, production depletion rates and the resultant levels of cash flows generated and allocated by exploration and production companies to their drilling, completion and related services and products budget. The oil and natural gas industry is also impacted by general domestic and international economic conditions, political instability in oil producing countries, government regulations (both in the United States and elsewhere), levels of customer demand, the availability of pipeline capacity and other conditions and factors that are beyond our control.
Demand for most of our products and services depends substantially on the level of expenditures by companies in the oil and natural gas industry. The significant decline in oil and natural gas prices that began in the third quarter of 2014 continued into February 2016, when the closing price of oil reached a 12-year low of $26.19 per barrel on February 11, 2016. The low commodity price environment caused a reduction in the drilling, completion and other production activities of most of our customers and their spending on our products and services.
The reduction in demand, and the resulting oversupply of many of the services and products we provide, has substantially reduced the prices we can charge our customers for our products and services, and has had a negative impact on the utilization of our services. This overall trend with respect to our customers’ activities and spending has continued in 2016. However, oil prices have increased since the 12-year low recorded on February 26, 2016, reaching $51.23 per barrel in June 2016, and have ranged from $39.50 to $48.48 per barrel during August 2016. As commodity prices have begun to recover, we have experienced an increase in activity. If near term commodity prices stabilize at current levels and recover further, we expect to experience further increase in demand for our services and products, particularly in our completion and production, natural sand proppant and contract land and directional drilling businesses. Spears and Associates, Inc. estimates a recovery to 1,089 active drilling rigs in the United States by 2020, with a projected 27,000 new wells being drilled by 2020. We expect that the projected increased drilling activity will result in increased demand for our completion and production services.
78
Although the ongoing volatility and depressed levels of activity are expected to persist until supply and demand for oil and natural gas come into balance, we believe that the following trends in our industry should benefit our operations and our ability to achieve our primary business objective as commodity prices recover:
| • | Increased U.S. Petroleum field Production. According to the EIA, U.S. average petroleum field production was approximately 12.1 million barrels per day during June 2016, only 4.7% below the record high average daily petroleum field production set in 2015. U.S. average petroleum field production has grown at a compound annual growth rate of 9.8% over the period from 2009 through 2015 due to production gains from unconventional reservoirs. We expect that this continued growth will result in increased demand for our services as commodity prices continue to stabilize and increase. |
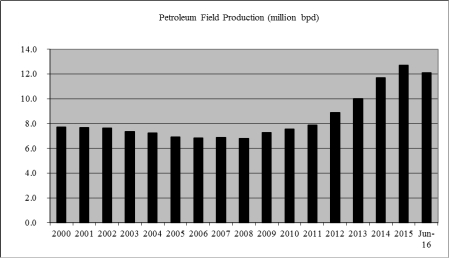
| • | Increased use of horizontal drilling to develop unconventional resource plays. According to Baker Hughes, the horizontal rig count on August 5, 2016 was 362, or approximately 78% of the total U.S. onshore rig count. Although the overall onshore rig count declined significantly from September 2014 to May 2016, the horizontal rig count as a percentage of the overall onshore rig count has increased every year since 2007 when horizontal rigs represented only approximately 25% of the total U.S. onshore rig count at year-end. As a result of improvements in drilling and production-enhancement technologies, oil and natural gas companies are increasingly developing unconventional resources such as tight sands and shales. Successful and economic production of these unconventional resource plays frequently requires horizontal drilling, fracturing and stimulation services. Drilling related activity for unconventional resources is typically done on tighter acre-spacing and thus requires that more wells be drilled relative to conventional resources. We believe that all of these characteristics will drive the demand for our services in an improved commodity price environment. |
79
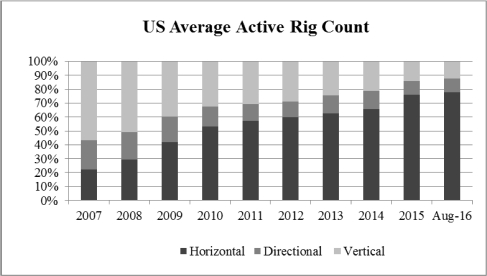
Percentages at year end unless otherwise indicated.
| • | Tight oil production growth is expected to continue to be the primary driver of U.S. oil production growth. According to the EIA, U.S. tight oil production grew from 380,000 barrels per day in 2007 to almost 4.9 million barrels per day in 2015, representing 52% of total U.S. crude oil production in 2015. A majority of this increase came from the Eagle Ford play in South Texas, the Bakken Shale in the Williston Basin of North Dakota and Montana, and the Permian Basin in West Texas. We believe the Utica Shale and the Permian Basin, our primary business locations, will be key drivers of U.S. tight oil and natural gas production as those plays are developed further in the coming years due to the favorable well economics in those basins. |
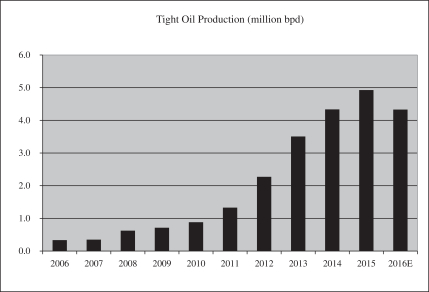
| • | Horizontal wells are heavily dependent on oil field services. According to Baker Hughes, as of August 5, 2016, horizontal rigs accounted for approximately 78% of all rigs drilling in the United States, up from 25% at year-end 2007. The scope of services for a horizontal well are greater than for |
80
| a conventional well. Industry analysts report that the average horsepower, length of the lateral and number of fracture stages has continued to increase since 2008. We believe our commitment to provide services in unconventional plays, such as the Utica Shale and the Permian Basin, provide us the opportunity to compete in those regional markets where the majority of total footage is drilled each year in the United States. |
| • | New and emerging unconventional resource plays. In addition to the development of existing unconventional resource plays such as the Permian, Utica, Bakken, Eagle Ford, Barnett, Fayetteville, Cotton Valley, Haynesville, Marcellus and Woodford Shales, exploration and production companies continue to find new unconventional resources. These include oil and liquids-based shales in the Cana Woodford, Granite Wash, Niobrara, Woodford and Scoop and Stack resource plays. In certain cases, exploration and production companies have acquired vast acreage positions in these plays that require them to drill and produce hydrocarbons to hold the leased acreage. We believe these unconventional resource plays will increasingly drive demand for our services as commodity prices continue to recover as they typically require the use of extended reach horizontal drilling, multiple stage fracture stimulation and high pressure completion capabilities. We also believe we are well-positioned to expand our services in two major unconventional plays, the Utica Shale in Ohio and the Permian Basin in West Texas. |
| • | Need for additional drilling activity to maintain production levels. With the increased maturity of the onshore conventional and, in many cases, unconventional resource plays, oil and natural gas production may be characterized as having steeper initial decline curves. Given average decline rates and the substantial reduction in activity over the past year, we believe that the number of wells drilled is likely to increase in coming years as commodity prices continue to recover. Once a well has been drilled, it requires recurring production and completion services, which we believe will also drive demand for our services. |
Our Strengths
Our primary business objective is to grow our operations and create value for our stockholders through growth opportunities and accretive acquisitions. We believe that the following strengths position us well to capitalize on activity in unconventional resource plays and achieve our primary business objective:
| • | Modern fleet of equipment designed for horizontal wells. Our service fleet is predominantly comprised of equipment designed to optimize recovery from unconventional wells. As of August 1, 2016, approximately 72% of our high pressure fracturing units had been purpose built within the last three years. Our pressure control equipment has been designed by us and has an average age of approximately three years. Our accommodation units have an average age of approximately five years and are built on a customer-by-customer basis to meet their specific needs. We believe that our modern fleet of quality equipment will allow us to provide a high level of service to our customers and capitalize on future growth in the unconventional resource plays that we serve. |
| • | Strategic geographic positioning, including primary presence in the Utica Shale and the Permian Basin. We currently operate facilities and service centers to support our operations in major unconventional resource plays in the United States, including the Utica Shale in Eastern Ohio, the Permian Basin in West Texas, the Marcellus Shale in Pennsylvania, the Granite Wash in Oklahoma and Texas, the Cana Woodford Shale and the Cleveland Sand in Oklahoma, the Eagle Ford Shale in South Texas and the oil sands in Alberta, Canada. We believe our geographic positioning within active oil and natural gas liquids resource plays will benefit us strategically as activity increases in these unconventional resource plays. |
| • | Long-term contractual and other basin-level relationships with a stable customer base. We are party to a long-term contract with Gulfport to provide pressure pumping services and natural sand proppant |
81
| services through September 2018. In addition, our operational division heads and field managers have formed long-term relationships with our customer base. We believe these contractual and other relationships help provide us a more stable and growth-oriented client base in the unconventional shale markets that we currently serve. Our customers include large independent oil and natural gas exploration and production companies. Our top five customers for the year ended December 31, 2015, representing 71% of our revenue, were Gulfport, EQT Production Company, Oil Sands Limited, RSP Permian LLC and Bantrel Co. Our top five customers for the six months ended June 30, 2016, representing 80% of our revenue, were Gulfport, Rice Energy Inc., Oil Sands Limited, Hilcorp Energy Company and Taylor Frac LLC. |
| • | Experienced management and operating team. Our operational division heads have an extensive track record in the oilfield services business with an average of over 34 years of oilfield services experience. In addition, our field managers have expertise in the geological basins in which they operate and understand the regional challenges that our customers face. We believe their knowledge of our industry and business lines enhances our ability to provide innovative, client-focused and basin-specific customer service, which we also believe strengthens our relationships with our customers. |
Our Business Strategy
We intend to achieve our primary business objective by the successful execution of our business plan to strategically deploy our equipment and personnel to provide completion and production services, natural sand proppant, drilling and remote accommodation services in unconventional resource plays, including the Utica Shale in Ohio and the Permian Basin in West Texas. We believe these services optimize our customers’ ultimate resources recovery and present value of hydrocarbon reserves. We seek to create cost efficiencies for our customers by providing a suite of complementary oilfield services designed to address a wide range of our customers’ needs. Specifically, we intend to create value for our stockholders through the following strategies:
| • | Capitalize on the recovery in activity in the unconventional resource plays. Our equipment is designed to provide a broad range of services for unconventional wells, and our operations are strategically located in major unconventional resource plays. During the first six months of 2016, oil prices rose from a low of $26.19 per barrel on February 11, 2016 to a high of $51.23 per barrel on June 8, 2016. During August 2016, oil prices ranged from $39.50 to $ 48.48 per barrel. As commodity prices began to recover, we experienced an increase in activity. If near term commodity prices stabilize at current levels and recover further, we expect to experience further increase in demand for our services and products. We intend to capitalize on the anticipated increase in activity in these markets and diversify our operations across additional unconventional resource basins. Our core operations are currently focused in the Utica Shale in Ohio and the Permian Basin in West Texas. We intend to continue to strategically deploy assets to these and other unconventional resource basins and will look to capitalize on further growth in emerging unconventional resource plays as they develop. |
| • | Leverage our broad range of services for unconventional wells for cross-selling opportunities. We offer a complementary suite of oilfield services and products. Our completion and production division provides pressure pumping services, pressure control services and flowback services for unconventional wells. Our natural sand proppant services division sells and produces proppant for hydraulic fracturing. Our drilling services division adds drilling capabilities to our other well-related services. We intend to leverage our existing customer relationships and operational track record to cross sell our services and increase our exposure and product offerings to our existing customers, broaden our customer base and expand opportunistically to other geographic regions in which our customers have operations, as well as to create operational efficiencies for our customers. |
82
| • | Expand through selected, accretive acquisitions. To complement our organic growth, we intend to actively pursue selected, accretive acquisitions of businesses and assets, primarily related to our completion and production services and natural sand proppant services, that can meet our targeted returns on invested capital and enhance our portfolio of products and services, market positioning and/or geographic presence. We believe this strategy will facilitate the continued expansion of our customer base, geographic presence and service offerings. We also believe that our industry contacts and those of Wexford, our equity sponsor and largest stockholder, will facilitate the identification of acquisition opportunities. We expect to use our common stock as consideration for accretive acquisitions. |
| • | Maintain a conservative balance sheet. We seek to maintain a conservative balance sheet, which allows us to better react to changes in commodity prices and related demand for our services, as well as overall market conditions. We expect to repay all outstanding borrowings under our revolving credit facility with a portion of the net proceeds from this offering and will have no outstanding debt immediately after this offering. |
| • | Expand our services to meet expanding customer demand. The scope of services for horizontal wells is greater than that for conventional wells. Industry analysts have reported that the average horsepower, length of lateral and number of fracture stages has continued to increase since 2008. We consistently monitor market conditions and intend to expand the capacity and scope of our business lines as demand warrants in resource plays in which we currently operate, as well as in new resource plays. If we perceive unmet demand in our principal geographic locations for different service lines, we will seek to expand our current service offerings to meet that demand. |
| • | Leverage our experienced operational management team and basin-level expertise. We seek to manage the services we provide as closely as possible to the needs of our customer base. Our operational division heads have long-term relationships with our largest customers. We intend to leverage these relationships and our operational management team’s basin-level expertise to deliver innovative, client focused and basin-specific services to our customers. |
Properties
Our corporate headquarters are located at 4727 Gaillardia Parkway, Suite 200, Oklahoma City, Oklahoma 73142. We currently own eight properties, three located in Ohio, two located in Wisconsin, one located in Texas and two located in Canada, which are used for field offices, yards, production plants or housing. In addition to our headquarters, we also lease fourteen properties that are used for field offices, yards or transloading facilities for frac sand. We lease eleven of these properties from third parties and three of these properties from related parties.
We believe that our facilities are adequate for our current operations.
Marketing and Customers
Our customers consist primarily of independent oil and natural gas producers and land-based drilling contractors in North America. For the six months ended June 30, 2016 and the year ended December 31, 2015, we had approximately 104 and 116 customers, respectively, including Gulfport, EQT Production Company, Oil Sands Limited, RSP Permian and Rice Energy. Our top five customers accounted for approximately 80% and 71% of our revenue, for the six months ended June 30, 2016 and the year ended December 31, 2015, respectively. During the six months ended June 30, 2016, Gulfport accounted for 49%, Rice Energy accounted for 12% and Oil Sands Limited accounted for 11% of our revenue. For the year ended December 31, 2015, Gulfport accounted for 47% and EQT Production Company accounted for 12% of our revenue. Although we believe we have a broad customer base and wide geographic coverage of operations, it is likely that we will continue to derive a significant portion of our revenue from a relatively small number of customers in the future. If a major customer decided not to continue to use our services, revenue could decline and our operating results and financial condition could be harmed.
83
Operating Risks and Insurance
Our operations are subject to hazards inherent in the oilfield services industry, such as accidents, blowouts, explosions, fires and spills and releases that can cause:
| • | personal injury or loss of life; |
| • | damage or destruction of property, equipment, natural resources and the environment; and |
| • | suspension of operations. |
In addition, claims for loss of oil and natural gas production and damage to formations can occur in the oilfield services industry. If a serious accident were to occur at a location where our equipment and services are being used, it could result in us being named as a defendant in lawsuits asserting large claims.
Because our business involves the transportation of heavy equipment and materials, we may also experience traffic accidents which may result in spills, property damage and personal injury.
Despite our efforts to maintain safety standards, we from time to time have suffered accidents in the past and anticipate that we could experience accidents in the future. In addition to the property damage, personal injury and other losses from these accidents, the frequency and severity of these incidents affect our operating costs and insurability and our relationships with customers, employees, regulatory agencies and other parties. Any significant increase in the frequency or severity of these incidents, or the general level of compensation awards, could adversely affect the cost of, or our ability to obtain, workers’ compensation and other forms of insurance, and could have other material adverse effects on our financial condition and results of operations.
We maintain commercial general liability, workers’ compensation, business auto, commercial property, motor truck cargo, umbrella liability, in certain instances, excess liability, and directors and officers insurance policies providing coverages of risks and amounts that we believe to be customary in our industry. Further, we have pollution legal liability coverage for our business entities, which would cover, among other things, third party liability and costs of clean-up relating to environmental contamination on our premises while our equipment and chemicals are in transit and while on our customers’ job site. With respect to our hydraulic fracturing operations, coverage would be available under our pollution legal liability policy for any surface or subsurface environmental clean-up and liability to third parties arising from any surface or subsurface contamination. We also have certain specific coverages for some of our businesses, including our remote accommodation services, pressure pumping services and contract and directional drilling services.
Although we maintain insurance coverage of types and amounts that we believe to be customary in the industry, we are not fully insured against all risks, either because insurance is not available or because of the high premium costs relative to perceived risk. Further, insurance rates have in the past been subject to wide fluctuation and changes in coverage could result in less coverage, increases in cost or higher deductibles and retentions. Liabilities for which we are not insured, or which exceed the policy limits of our applicable insurance, could have a material adverse effect on us. See “Risk Factors” on page 16 of this prospectus for a description of certain risks associated with our insurance policies.
Safety and Remediation Program
In the oilfield services industry, an important competitive factor in establishing and maintaining long-term customer relationships is having an experienced and skilled workforce. Recently, many of our large customers have placed an emphasis not only on pricing, but also on safety records and quality management systems of contractors. We believe these factors will gain further importance in the future. We have committed resources toward employee safety and quality management training programs. Our field employees are required to
84
complete both technical and safety training programs. Further, as part of our safety program and remediation procedures, we check fluid lines for any defects on a periodic basis to avoid line failure during hydraulic fracturing operations, marking such fluid lines to reflect the most recent testing date. We also regularly monitor pressure levels in the fluid lines used for fracturing and the surface casing to verify that the pressure and flow rates are consistent with the job specific model in an effort to avoid failure. As part of our safety procedures, we also have the capability to shut down our pressure pumping and fracturing operations both at the lines and in our data van. In addition, we maintain spill kits on location for containment of pollutants that may be spilled in the process of providing our hydraulic fracturing services. The spill kits are generally comprised of pads and booms for absorption and containment of spills, as well as soda ash for neutralizing acid. Fire extinguishers are also in place on job sites at each pump.
Historically, we have used a third-party contractor to provide remediation and spill response services when necessary to address spills that were beyond our containment capabilities. None of these prior spills were significant, and we have not experienced any incidents, citations or legal proceeding relating to our hydraulic fracturing services for environmental concerns. To the extent our hydraulic fracturing or other oilfield services operations result in a future spill, leak or other environmental impact that is beyond our ability to contain, we intend to engage the services of such remediation company or an alternative company to assist us with clean-up and remediation.
Competition
The markets in which we operate are highly competitive. To be successful, a company must provide services and products that meet the specific needs of oil and natural gas exploration and production companies and drilling services contractors at competitive prices.
We provide our services and products across the United States and in Alberta, Canada and we compete against different companies in each service and product line we offer. Our competition includes many large and small oilfield service companies, including the largest integrated oilfield services companies.
Our major competitors for our pressure control services include Schlumberger Limited, Halliburton Company, Baker Hughes Incorporated, Weatherford International Ltd., Key Energy Services Inc., Nabors Industries Ltd., Complete Energy Services, Inc. and RPC Incorporated and a significant number of locally oriented businesses. Our major competitors in pressure pumping services include Halliburton Company, U.S. Well Services, LLC, Schlumberger Limited, Weatherford International Ltd, C&J Energy Services Ltd., RPC Incorporated, Complete Energy Services, Inc. and FracTech Services, Inc. In our contract and directional drilling services segment, our primary competitors include Helmerich & Payne, Inc., Precision Drilling Corporation, Patterson-UTI Energy, Inc., Cactus Drilling, Sidewinder Drilling, Inc., Baker Hughes Incorporated, Weatherford International Ltd. and various regional and local service providers. Our major competitors in our proppant production and sales business are Badger Mining Corporation, Fairmount Minerals, Ltd., Hi-Crush Partners LP, Preferred Proppants LLC, Unimin Corporation and U.S. Silica Holdings Inc. Our major competitors for our remote accommodation business include Oil States International, Inc., Black Diamond Limited and a significant number of local businesses.
We believe that the principal competitive factors in the market areas that we serve are quality of service and products, reputation for safety and technical proficiency, availability and price. While we must be competitive in our pricing, we believe our customers select our services and products based on the local leadership and basin-expertise that our field management and operating personnel use to deliver quality services and products.
Regulation
We operate under the jurisdiction of a number of regulatory bodies that regulate worker safety standards, the handling of hazardous materials, the transportation of explosives, the protection of human health and the
85
environment and driving standards of operation. Regulations concerning equipment certification create an ongoing need for regular maintenance which is incorporated into our daily operating procedures. The oil and natural gas industry is subject to environmental regulation pursuant to local, state and federal legislation.
Transportation Matters
In connection with our transportation and relocation of our oilfield service equipment and shipment of frac sand, we operate trucks and other heavy equipment. As such, we operate as a motor carrier in providing certain of our services and therefore are subject to regulation by the United States Department of Transportation and by various state agencies. These regulatory authorities exercise broad powers, governing activities such as the authorization to engage in motor carrier operations, driver licensing and insurance requirements, financial reporting and review of certain mergers, consolidations and acquisitions, and transportation of hazardous materials (HAZMAT). Our trucking operations are subject to possible regulatory and legislative changes that may increase our costs. Some of these possible changes include increasingly stringent environmental regulations, changes in the hours of service regulations which govern the amount of time a driver may drive or work in any specific period, onboard black box recorder device requirements or limits on vehicle weight and size.
Interstate motor carrier operations are subject to safety requirements prescribed by the Federal Motor Carrier Safety Administration, or FMCSA, a unit within the United States Department of Transportation. To a large degree, intrastate motor carrier operations are subject to state safety regulations that mirror federal regulations. Matters such as the weight and dimensions of equipment are also subject to federal and state regulations. From time to time, various legislative proposals are introduced, including proposals to increase federal, state or local taxes, including taxes on motor fuels, which may increase our costs or adversely impact the recruitment of drivers. We cannot predict whether, or in what form, any increase in such taxes applicable to us will be enacted.
Certain motor vehicle operators require registration with the Department of Transportation. This registration requires an acceptable operating record. The Department of Transportation periodically conducts compliance reviews and may revoke registration privileges based on certain safety performance criteria which could result in a suspension of operations. The rating scale consists of “satisfactory,” “conditional” and “unsatisfactory” ratings. As of May 1, 2016, all of our trucking operations have “satisfactory” ratings with the Department of Transportation. We have undertaken comprehensive efforts that we believe are adequate to comply with the regulations. Further information regarding our safety performance is available at the FMCSA website at www.fmcsa.dot.gov.
In December 2010, the FMCSA launched a program called Compliance, Safety, Accountability, or CSA, in an effort to improve commercial truck and bus safety. A component of CSA is the Safety Measurement System, or SMS, which analyzes all safety violations recorded by federal and state law enforcement personnel to determine a carrier’s safety performance. The SMS is intended to allow FMCSA to identify carriers with safety issues and intervene to address those problems. However, the agency has announced a future intention to revise its safety rating system by making greater use of SMS data in lieu of on-site compliance audits of carriers. At this time, we cannot predict the effect such a revision may have on our safety rating.
Environmental Matters and Regulation
Our operations are subject to stringent laws and regulations governing the discharge of materials into the environment or otherwise relating to environmental protection. Numerous federal, state and local governmental agencies, such as the U.S. Environmental Protection Agency, or the EPA, issue regulations that often require difficult and costly compliance measures that carry substantial administrative, civil and criminal penalties and may result in injunctive obligations for non-compliance. These laws and regulations may require the acquisition of a permit before drilling commences, restrict the types, quantities and concentrations of various substances that can be released into the environment in connection with drilling activities, limit or prohibit construction or
86
drilling activities on certain lands lying within wilderness, wetlands, ecologically or seismically sensitive areas and other protected areas, require action to prevent or remediate pollution from current or former operations, such as plugging abandoned wells or closing pits, result in the suspension or revocation of necessary permits, licenses and authorizations, require that additional pollution controls be installed and impose substantial liabilities for pollution resulting from our operations or relate to our owned or operated facilities. Liability under such laws and regulations is strict (i.e., no showing of “fault” is required) and can be joint and several. Moreover, it is not uncommon for neighboring landowners and other third parties to file claims for personal injury and property damage allegedly caused by the release of hazardous substances, hydrocarbons or other waste products into the environment. Changes in environmental laws and regulations occur frequently, and any changes that result in more stringent and costly pollution control or waste handling, storage, transport, disposal or cleanup requirements could materially adversely affect our operations and financial position, as well as the oil and natural gas industry in general. We have not experienced any material adverse effect from compliance with these environmental requirements. This trend, however, may not continue in the future.
Waste Handling. We handle, transport, store and dispose of wastes that are subject to the federal Resource Conservation and Recovery Act, as amended, or RCRA, and comparable state statutes and regulations promulgated thereunder, which affect our activities by imposing requirements regarding the generation, transportation, treatment, storage, disposal and cleanup of hazardous and non-hazardous wastes. With federal approval, the individual states administer some or all of the provisions of RCRA, sometimes in conjunction with their own, more stringent requirements. Although certain petroleum production wastes are exempt from regulation as hazardous wastes under RCRA, such wastes may constitute “solid wastes” that are subject to the less stringent requirements of non-hazardous waste provisions.
Administrative, civil and criminal penalties can be imposed for failure to comply with waste handling requirements. Moreover, the EPA or state or local governments may adopt more stringent requirements for the handling of non-hazardous wastes or categorize some non-hazardous wastes as hazardous for future regulation. Indeed, legislation has been proposed from time to time in Congress to re-categorize certain oil and natural gas exploration, development and production wastes as “hazardous wastes.” Several environmental organizations have also petitioned the EPA to modify existing regulations to recategorize certain oil and natural gas exploration, development and production wastes as “hazardous.” Any such changes in the laws and regulations could have a material adverse effect on our capital expenditures and operating expenses. Although we do not believe the current costs of managing our wastes, as presently classified, to be significant, any legislative or regulatory reclassification of oil and natural gas exploration and production wastes could increase our costs to manage and dispose of such wastes.
Remediation of Hazardous Substances. The Comprehensive Environmental Response, Compensation and Liability Act, as amended, which we refer to as CERCLA, or the “Superfund” law, and analogous state laws, generally imposes liability, without regard to fault or legality of the original conduct, on classes of persons who are considered to be responsible for the release of a “hazardous substance” into the environment. These persons include the current owner or operator of a contaminated facility, a former owner or operator of the facility at the time of contamination and those persons that disposed or arranged for the disposal of the hazardous substance at the facility. Under CERCLA and comparable state statutes, persons deemed “responsible parties” are subject to strict liability, that, in some circumstances, may be joint and several for the costs of removing or remediating previously disposed wastes (including wastes disposed of or released by prior owners or operators) or property contamination (including groundwater contamination), for damages to natural resources and for the costs of certain health studies. In addition, it is not uncommon for neighboring landowners and other third parties to file claims for personal injury and property damage allegedly caused by the hazardous substances released into the environment. In the course of our operations, we use materials that, if released, would be subject to CERCLA and comparable state statutes. Therefore, governmental agencies or third parties may seek to hold us responsible under CERCLA and comparable state statutes for all or part of the costs to clean up sites at which such “hazardous substances” have been released.
87
NORM. In the course of our operations, some of our equipment may be exposed to naturally occurring radioactive materials associated with oil and gas deposits and, accordingly may result in the generation of wastes and other materials containing naturally occurring radioactive materials, or NORM. NORM exhibiting levels of naturally occurring radiation in excess of established state standards are subject to special handling and disposal requirements, and any storage vessels, piping and work area affected by NORM may be subject to remediation or restoration requirements. Because certain of the properties presently or previously owned, operated or occupied by us may have been used for oil and gas production operations, it is possible that we may incur costs or liabilities associated with NORM.
Water Discharges. The Federal Water Pollution Control Act of 1972, as amended, also known as the “Clean Water Act,” the Safe Drinking Water Act, the Oil Pollution Act and analogous state laws and regulations promulgated thereunder impose restrictions and strict controls regarding the unauthorized discharge of pollutants, including produced waters and other gas and oil wastes, into navigable waters of the United States, as well as state waters. The discharge of pollutants into regulated waters is prohibited, except in accordance with the terms of a permit issued by the EPA or the state. The Clean Water Act and regulations implemented thereunder also prohibit the discharge of dredge and fill material into regulated waters, including jurisdictional wetlands, unless authorized by an appropriately issued permit. These laws and regulations also prohibit certain other activity in wetlands unless authorized by a permit issued by the Corps. In September 2015, a new EPA and U.S. Army Corps of Engineers, which we refer to as the Corps, rule defining the scope of the jurisdiction of the EPA and the Corps over wetlands and other waters became effective. To the extent the rule expands the range of properties subject to the Clean Water Act’s jurisdiction, certain energy companies could face increased costs and delays with respect to obtaining permits for dredge and fill activities in wetland areas. The rule has been challenged in court on the grounds that it unlawfully expands the reach of Clean Water Act programs, and implementation of the rule has been stayed pending resolution of the court challenge. The process for obtaining permits has the potential to delay the development of natural gas and oil projects. Also, spill prevention, control and countermeasure plan requirements under federal law require appropriate containment berms and similar structures to help prevent the contamination of navigable waters. Noncompliance with these requirements may result in substantial administrative, civil and criminal penalties, as well as injunctive obligations.
Air Emissions. The federal Clean Air Act, as amended, and comparable state laws and regulations, regulate emissions of various air pollutants through the issuance of permits and the imposition of other requirements. The EPA has developed, and continues to develop, stringent regulations governing emissions of air pollutants at specified sources. New facilities may be required to obtain permits before work can begin, and existing facilities may be required to obtain additional permits and incur capital costs in order to remain in compliance. For example, our sand proppant production operations are subject to air permits issued by the Wisconsin Department of Natural Resources regulating our emission of fugitive dust and other constituents. These and other laws and regulations may increase the costs of compliance for some facilities where we operate, and federal and state regulatory agencies can impose administrative, civil and criminal penalties for non-compliance with air permits or other requirements of the federal Clean Air Act and associated state laws and regulations. Obtaining or renewing permits has the potential to delay the development of oil and natural gas projects.
Climate Change. In December 2009, the EPA issued an Endangerment Finding that determined that emissions of carbon dioxide, methane and other greenhouse gases, or collectively referred to as GHGs, present an endangerment to public health and the environment because, according to the EPA, emissions of such gases contribute to warming of the earth’s atmosphere and other climatic changes. These findings by the EPA allowed the agency to proceed with the adoption and implementation of regulations that would restrict emissions of GHGs under existing provisions of the federal Clean Air Act. Subsequently, the EPA adopted two sets of related rules, one of which purports to regulate emissions of GHGs from motor vehicles and the other of which regulates emissions of GHGs from certain large stationary sources of emissions such as power plants or industrial facilities. The motor vehicle rule, which became effective in July 2010, purports to limit emissions of GHGs from motor vehicles. The EPA adopted the stationary source rule, which we refer to as the tailoring rule, in May 2010, and it became effective January 2011. The tailoring rule established new GHG emissions thresholds that
88
determine when stationary sources must obtain permits under the PSD and Title V programs of the Clean Air Act. On June 23, 2014, in Utility Air Regulatory Group v. EPA, the Supreme Court held that stationary sources could not become subject to PSD or Title V permitting solely by reason of their GHG emissions. The Court ruled, however, that the EPA may require installation of best available control technology for GHG emissions at sources otherwise subject to the PSD and Title V programs. On December 19, 2014, the EPA issued two memoranda providing initial guidance on GHG permitting requirements in response to the Court’s decision in Utility Air Regulatory Group v. EPA. In its preliminary guidance, the EPA indicates it will undertake a rulemaking action to rescind any PSD permits issued under the portions of the tailoring rule that were vacated by the Court. In the interim, the EPA issued a narrowly crafted “no action assurance” indicating it will exercise its enforcement discretion not to pursue enforcement of the terms and conditions relating to GHGs in an EPA-issued PSD permit, and for related terms and conditions in a Title V permit. On April 30, 2015, the EPA issued a final rule allowing permitting authorities to rescind PSD permits issued under the invalid regulations.
Additionally, in September 2009, the EPA issued a final rule requiring the reporting of GHG emissions from specified large GHG emission sources in the U.S., including natural gas liquids fractionators and local natural gas distribution companies, beginning in 2011 for emissions occurring in 2010. In November 2010, the EPA expanded the GHG reporting rule to include onshore and offshore oil and natural gas production and onshore processing, transmission, storage and distribution facilities, which may include certain of our customers’ facilities, beginning in 2012 for emissions occurring in 2011. In October 2015, the EPA amended the GHG reporting rule to add the reporting of GHG emissions from gathering and boosting systems, completions and workovers of oil wells using hydraulic fracturing, and blowdowns of natural gas transmission pipelines.
The EPA has continued to adopt GHG regulations applicable to other industries, such as its August 2015 adoption of three separate, but related, actions to address carbon dioxide pollution from power plants, including final Carbon Pollution Standards for new, modified and reconstructed power plants, a final Clean Power Plan to cut carbon dioxide pollution from existing power plants, and a proposed federal plan to implement the Clean Power Plan emission guidelines. Upon publication of the Clean Power Plan on October 23, 2015, more than two dozen states as well as industry and labor groups challenged the Clean Power Plan in the D.C. Circuit Court of Appeals. As a result of this continued regulatory focus, future GHG regulations of the oil and gas industry remain a possibility, which could increase the cost of our operation and reduce the demand for our products and services.
In addition, the U.S. Congress has from time to time considered adopting legislation to reduce emissions of GHGs and almost one-half of the states have already taken legal measures to reduce emissions of GHGs primarily through the planned development of GHG emission inventories and/or regional GHG cap and trade programs. Although the U.S. Congress has not adopted such legislation at this time, it may do so in the future and many states continue to pursue regulations to reduce GHG emissions. Most of these cap and trade programs work by requiring major sources of emissions, such as electric power plants or major producers of fuels, such as refineries and gas processing plants, to acquire and surrender emission allowances corresponding with their annual emissions of GHGs. The number of allowances available for purchase is reduced each year until the overall GHG emission reduction goal is achieved. As the number of GHG emission allowances declines each year, the cost or value of such allowances is expected to escalate significantly.
In December 2015, the United States joined the international community at the 21st Conference of the Parties of the United Nations Framework Convention on Climate Change in Paris, France. The resulting Paris Agreement calls for the parties to undertake “ambitious efforts” to limit the average global temperature, and to conserve and enhance sinks and reservoirs of greenhouse gases. The Paris Agreement, if ratified, establishes a framework for the parties to cooperate and report actions to reduce greenhouse gas emissions.
Restrictions on emissions of methane or carbon dioxide that may be imposed in various states could adversely affect the oil and natural gas industry by reducing demand for hydrocarbons and by making it more expensive to develop and produce hydrocarbons, either of which could have a material adverse effect on future demand for our services. At this time, it is not possible to accurately estimate how potential future laws or regulations addressing GHG emissions would impact our business.
89
In addition, claims have been made against certain energy companies alleging that greenhouse gas emissions from oil and natural gas operations constitute a public nuisance under federal and/or state common law. As a result, private individuals may seek to enforce environmental laws and regulations against certain energy companies and could allege personal injury or property damages. While our business is not a party to any such litigation, we could be named in actions making similar allegations. An unfavorable ruling in any such case could significantly impact our operations and could have an adverse impact on our financial condition.
Moreover, climate change may cause more extreme weather conditions such as more intense hurricanes, thunderstorms, tornadoes and snow or ice storms, as well as rising sea levels and increased volatility in seasonal temperatures. Extreme weather conditions can interfere with our production and increase our costs and damage resulting from extreme weather may not be fully insured. However, at this time, we are unable to determine the extent to which climate change may lead to increased storm or weather hazards affecting our operations.
Endangered Species Act
Environmental laws such as the Endangered Species Act, as amended, or the ESA, may impact exploration, development and production activities on public or private lands. The ESA provides broad protection for species of fish, wildlife and plants that are listed as threatened or endangered in the U.S., and prohibits taking of endangered species. Similar protections are offered to migratory birds under the Migratory Bird Treaty Act. Federal agencies are required to insure that any action authorized, funded or carried out by them is not likely to jeopardize the continued existence of listed species or modify their critical habitat. While some of our facilities may be located in areas that are designated as habitat for endangered or threatened species, we believe that we are in substantial compliance with the ESA. The U.S. Fish and Wildlife Service may identify, however, previously unidentified endangered or threatened species or may designate critical habitat and suitable habitat areas that it believes are necessary for survival of a threatened or endangered species, which could cause us to incur additional costs or become subject to operating restrictions or bans in the affected areas.
Regulation of Hydraulic Fracturing
Our business is dependent on our ability to conduct hydraulic fracturing and horizontal drilling activities. Hydraulic fracturing is an important common practice that is used to stimulate production of hydrocarbons, particularly natural gas, from tight formations, including shales. The process, which involves the injection of water, sand and chemicals (also called “proppants”) under pressure into formations to fracture the surrounding rock and stimulate production, is typically regulated by state oil and natural gas commissions. However, federal agencies have asserted regulatory authority over certain aspects of the process. For example, on May 9, 2014, the EPA issued an Advanced Notice of Proposed Rulemaking seeking comment on the development of regulations under the Toxic Substances Control Act to require companies to disclose information regarding the chemicals used in hydraulic fracturing. The EPA plans to develop a Notice of Proposed Rulemaking by June 2017, which would describe a proposed mechanism—regulatory, voluntary or a combination of both—to collect data on hydraulic fracturing chemical substances and mixtures. On June 28, 2016, EPA published a final rule prohibiting the discharge of wastewater from onshore unconventional oil and natural gas extraction facilities to publicly owned wastewater treatment plans. The EPA is also conducting a study of private wastewater treatment facilities (also known as centralized waste treatment, or CWT, facilities) accepting oil and natural gas extraction wastewater. The EPA is collecting data and information related to the extent to which CWT facilities accept such wastewater, available treatment technologies (and their associated costs), discharge characteristics, financial characteristics of CWT facilities and the environmental impacts of discharges from CWT facilities. Furthermore, legislation to amend the Safe Drinking Water Act, or SDWA, to repeal the exemption for hydraulic fracturing (except when diesel fuels are used) from the definition of “underground injection” and require federal permitting and regulatory control of hydraulic fracturing, as well as legislative proposals to require disclosure of the chemical constituents of the fluids used in the fracturing process, were proposed in recent sessions of Congress.
90
On August 16, 2012, the EPA published final regulations under the federal Clean Air Act that establish new air emission controls for oil and natural gas production and natural gas processing operations. Specifically, the EPA’s rule package includes New Source Performance standards, which we refer to as NSP standards, to address emissions of sulfur dioxide and volatile organic compounds and a separate set of emission standards to address hazardous air pollutants frequently associated with oil and natural gas production and processing activities. The final rule seeks to achieve a 95% reduction in volatile organic compounds emitted by requiring the use of reduced emission completions or “green completions” on all hydraulically-fractured wells constructed or refractured after January 1, 2015. The rules also establish specific new requirements regarding emissions from compressors, controllers, dehydrators, storage tanks and other production equipment. The EPA received numerous requests for reconsideration of these rules from both industry and the environmental community, and court challenges to the rules were also filed. In response, the EPA has issued, and will likely continue to issue, revised rules responsive to some of the requests for reconsideration. For example, in September 2013 and December 2014, the EPA amended its rules to extend compliance deadlines and to clarify the NSP standards. Further, on July 31, 2015, the EPA finalized two updates to the NSP standards to address the definition of low-pressure wells and references to tanks that are connected to one another (referred to as connected in parallel). In addition, on May 12, 2016, the EPA amended the NSP standards to impose new standards for methane and VOC emissions for certain new, modified and reconstructed equipment, processes and activities across the oil and natural gas sector. On the same day, the EPA finalized a plan to implement its minor new source review program in Indian country for oil and natural gas production, and it issued for public comment an information request that will require companies to provide extensive information instrumental for the development of regulations to reduce methane emissions from existing oil and gas sources. We cannot predict the final regulatory requirements or the cost to comply with such requirements with any certainty.
In addition, on March 26, 2015, the Bureau of Land Management, or BLM, published a final rule governing hydraulic fracturing on federal and Indian lands. The rule requires public disclosure of chemicals used in hydraulic fracturing, implementation of a casing and cementing program, management of recovered fluids, and submission to the BLM of detailed information about the proposed operation, including wellbore geology, the location of faults and fractures, and the depths of all usable water. On June 21, 2016, the United States District Court for Wyoming set aside the rule, holding that the BLM lacked Congressional authority to promulgate the rule. The BLM has appealed the decision to the Tenth Circuit Court of Appeals. Also, on January 22, 2016, the BLM announced a proposed rule to reduce the flaring, venting and leaking of methane from oil and gas operations on federal and Indian lands. The proposed rule would require operators to use currently available technologies and equipment to reduce flaring, periodically inspect their operations for leaks, and replace outdated equipment that vents large quantities of gas into the air. The rule would also clarify when operators owe the government royalties for flared gas.
There are certain governmental reviews either underway or being proposed that focus on the environmental aspects of hydraulic fracturing practices. These ongoing or proposed studies, depending on their degree of pursuit and whether any meaningful results are obtained, could spur initiatives to further regulate hydraulic fracturing under the SDWA or other regulatory authorities. The EPA is currently evaluating the potential impacts of hydraulic fracturing on drinking water resources. On February 6, 2015, the EPA released a report with findings and recommendations related to public concern about induced seismic activity from disposal wells. The report recommends strategies for managing and minimizing the potential for significant injection-induced seismic events. Other governmental agencies, including the U.S. Department of Energy, the U.S. Geological Survey, and the U.S. Government Accountability Office, have evaluated or are evaluating various other aspects of hydraulic fracturing. These ongoing or proposed studies could spur initiatives to further regulate hydraulic fracturing, and could ultimately make it more difficult or costly for us to perform fracturing and increase our costs of compliance and doing business.
Several states and local jurisdictions in which we or our customers operate have adopted or are considering adopting regulations that could restrict or prohibit hydraulic fracturing in certain circumstances, impose more stringent operating standards and/or require the disclosure of the composition of hydraulic fracturing fluids. Any
91
increased regulation of hydraulic fracturing could reduce the demand for our services and materially and adversely effect our reserves and results of operations.
There has been increasing public controversy regarding hydraulic fracturing with regard to the use of fracturing fluids, induced seismic activity, impacts on drinking water supplies, use of water and the potential for impacts to surface water, groundwater and the environment generally. A number of lawsuits and enforcement actions have been initiated across the country implicating hydraulic fracturing practices. If new laws or regulations that significantly restrict hydraulic fracturing are adopted, such laws could make it more difficult or costly for us to perform fracturing to stimulate production from tight formations as well as make it easier for third parties opposing the hydraulic fracturing process to initiate legal proceedings based on allegations that specific chemicals used in the fracturing process could adversely affect groundwater. In addition, if hydraulic fracturing is further regulated at the federal, state or local level, our customers’ fracturing activities could become subject to additional permitting and financial assurance requirements, more stringent construction specifications, increased monitoring, reporting and recordkeeping obligations, plugging and abandonment requirements and also to attendant permitting delays and potential increases in costs. Such legislative or regulatory changes could cause us or our customers to incur substantial compliance costs, and compliance or the consequences of any failure to comply by us could have a material adverse effect on our financial condition and results of operations. At this time, it is not possible to estimate the impact on our business of newly enacted or potential federal, state or local laws governing hydraulic fracturing.
Regulation of Sand Proppant Production
The MSHA has primary regulatory jurisdiction over commercial silica operations, including quarries, surface mines, underground mines and industrial mineral processing facilities. While we do not directly conduct any mining operations, we are dependent on several regulated mines for the supply of natural sand used in our proppant production. In addition, MSHA representatives perform at least two annual inspections of our production facilities to ensure employee and general site safety. To date, these inspections have not resulted in any citations for material violations of MSHA standards, and we believe we are in material compliance with MSHA requirements.
Other Regulation of the Oil and Natural Gas Industry
The oil and natural gas industry is extensively regulated by numerous federal, state and local authorities. Legislation affecting the oil and natural gas industry is under constant review for amendment or expansion, frequently increasing the regulatory burden. Also, numerous departments and agencies, both federal and state, are authorized by statute to issue rules and regulations that are binding on the oil and natural gas industry and its individual members, some of which carry substantial penalties for failure to comply. Although changes to the regulatory burden on the oil and natural gas industry could affect the demand for our services, we would not expect to be affected any differently or to any greater or lesser extent than other companies in the industry with similar operations.
Drilling. Our operations are subject to various types of regulation at the federal, state and local level. These types of regulation include requiring permits for the drilling of wells, drilling bonds and reports concerning operations. The states, and some counties and municipalities, in which we operate also regulate one or more of the following:
| • | the location of wells; |
| • | the method of drilling and casing wells; |
| • | the timing of construction or drilling activities, including seasonal wildlife closures; |
| • | the surface use and restoration of properties upon which wells are drilled; |
92
| • | the plugging and abandoning of wells; and |
| • | notice to, and consultation with, surface owners and other third parties. |
Federal, state and local regulations provide detailed requirements for the abandonment of wells, closure or decommissioning of production facilities and pipelines and for site restoration in areas where we operate. The Corps and many other state and local authorities also have regulations for plugging and abandonment, decommissioning and site restoration. Although the Corps does not require bonds or other financial assurances, some state agencies and municipalities do have such requirements.
State Regulation. The states in which we or our customers operate regulate the drilling for, and the production and gathering of, oil and natural gas, including through requirements relating to the method of developing new fields, the spacing and operation of wells and the prevention of waste of oil and natural gas resources. States may also regulate rates of production and may establish maximum daily production allowables from oil and natural gas wells based on market demand or resource conservation, or both. States do not regulate wellhead prices or engage in other similar direct economic regulation, but they may do so in the future. The effect of these regulations may be to limit the amount of oil and natural gas that may be produced from wells and to limit the number of wells or locations our customers can drill.
In July 2015, the Ohio Department of Natural Resources, or the ODNR, enacted a comprehensive set of rules to regulate the construction of well pads. Under these new rules, operators must submit detailed horizontal well pad site plans certified by a professional engineer for review by the ODNR Division of Oil and Gas Resources Management prior to the construction of a well pad. These rules will result in increased construction costs for operators. It is expected that the ODNR will pursue further initiatives in 2016, including additional emergency response rules.
The petroleum industry is also subject to compliance with various other federal, state and local regulations and laws. Some of those laws relate to resource conservation and equal employment opportunity. We do not believe that compliance with these laws will have a material adverse effect on us.
OSHA Matters
We are also subject to the requirements of the federal Occupational Safety and Health Act, or OSHA, and comparable state statutes that regulate the protection of the health and safety of workers. In addition, the OSHA hazard communication standard requires that information be maintained about hazardous materials used or produced in operations and that this information be provided to employees, state and local government authorities and the public. Compliance with these laws and regulations has not had a material adverse effect on our operations or financial position.
Employees
As of August 1, 2016, we had approximately 500 full time employees, including 146 salaried administrative or supervisory employees. None of our employees are represented by labor unions or covered by any collective bargaining agreements. We also hire independent contractors and consultants involved in land, technical, regulatory and other disciplines to assist our full time employees.
Legal Proceedings
We are routinely involved in state and local tax audits. During year ended December 31, 2015 the State of Ohio assessed taxes on the purchase of equipment we believe is exempt under state law. We have appealed the assessment and have a hearing scheduled for November 30, 2016. While we are not able to predict the outcome of the appeal, however, we believe that this matter is not expected to have a material adverse effect on our financial position or results of operations.
93
On December 16, 2015, a lawsuit alleging wrongful death was filed titled Cecilia R.G. Uballe, and Sabrina Barber, beneficiarys of Esecial D. Uballe, Deceased v. Bison Trucking LLC in the U.S. District Court of Midland, Texas. We are evaluating the background facts of these actions and at this time are not able to predict the outcome of this lawsuit or whether it will have a material impact on our financial position, results of operations or cash flows.
Due to the nature of our business, we are, from time to time, involved in other routine litigation or subject to disputes or claims related to our business activities, including workers’ compensation claims and employment related disputes. In the opinion of our management, none of the pending litigation, disputes or claims against us, if decided adversely, will have a material adverse effect on our financial condition, cash flows or results of operations.
94
Executive Officers and Directors
Set forth below is the name, age, position and a brief account of the business experience of each of our executive officers, directors and director nominees as of August 1, 2016.
| Name |
Age | Position | ||
| Marc McCarthy |
45 | Chairman and Director | ||
| Arty Straehla |
62 | Chief Executive Officer and Director Nominee | ||
| Mark Layton |
42 | Chief Financial Officer | ||
| Aaron Gaydosik |
40 | Director Nominee | ||
| Arthur Smith |
63 | Director Nominee | ||
| André Weiss |
63 | Director Nominee |
Marc McCarthy has served as Chairman of the Board of Directors since our formation on June 3, 2016 and as Chairman of the Board of Directors of the general partner of Mammoth Partners since September 17, 2014. Mr. McCarthy is currently a Senior Managing Director at Wexford, having joined Wexford in June 2008. Mr. McCarthy has served as a director of Penn Virginia Corporation, an independent exploration and production company, since September 2016. Mr. McCarthy served as a director of Coronado Midstream LLC, a private gas gathering and processing operation in Midland, TX. From September 2009 until June 2013, Mr. McCarthy served as Chairman of the Board and a director of EPL Oil & Gas, Inc., an independent oil and natural gas exploration and production company. He also served on the Nominating and Governance Committee of EPL Oil & Gas, Inc. Before joining Wexford, Mr. McCarthy was a Senior Managing Director at Bear Stearns & Co., Inc. within its Global Equity Research Department having been responsible for coverage of the international oil and gas sector. Mr. McCarthy joined Bear Stearns & Co. in 1997 and held various positions of increasing responsibility until his departure in June 2008. Prior to 1997, he worked in equity research at Prudential Securities, also following the oil and gas sector. Mr. McCarthy is a Chartered Financial Analyst and received a B.A. in Economics from Tufts University. We believe Mr. McCarthy’s experience as a director of both publicly-traded and private oil and gas companies, as well as his experience in evaluating financial, strategic and operational aspects of companies in our industry at Wexford, qualifies him for service as a member of our board of directors.
Arty Straehla has served as our Chief Executive Officer since our formation on June 3, 2016 and has agreed to serve as a member of our board of directors prior to the closing of this offering. Mr. Straehla has served as the Chief Executive Officer of the general partner of Mammoth Partners since February 1, 2016. Prior to joining our company, Mr. Straehla was employed as Chief Executive Officer by Serva Group LLC, an oilfield equipment manufacturer, from July 2010 to January 2016. Mr. Straehla was employed by Diamondback Energy Services, Inc. from January 2006 to November 2008, where his last position was Chief Executive Officer. In December 2005, Mr. Straehla completed a 26-year career with the Goodyear Tire and Rubber Co. where his last position was the director of consumer tire manufacturing for the North American consumer tire operations. In this capacity, Mr. Straehla oversaw eight tire plants with 12,000 employees, a $2.5 billion operating budget, a $115.0 million capital expenditures budget and a production capacity of 100 million tires per year. Mr. Straehla holds a Bachelor of Science degree in Secondary Education and a Master of Arts degree in History from Oklahoma State University. Mr. Straehla also has a Master of Business Administration degree from Oklahoma City University. We believe Mr. Straehla’s experience in the oilfield services business, combined with his executive management experience, qualifies him for service as a member of our board of directors.
Mark Layton became our Chief Financial Officer in August 2014. Mr. Layton served as Chief Financial Officer of Stingray Pressure Pumping LLC from January 2014 to August 2014. Mr. Layton was employed from August 2011 through January 2014 by Archer Well Company Inc. where his last position was Director of Finance for North America. From September 2009 through August 2011, Mr. Layton was employed by Great White Energy Services, Inc. where his last position was Corporate Controller and Director of Financial Reporting. Mr. Layton served as Vice President of Finance of Crossroads Wireless, Inc., a wireless telecommunications service company, from May 2007 through September 2009. In February 2009, an involuntary petition under Chapter 7 of the United States Bankruptcy Code was filed against Crossroads
95
Wireless, Inc. in the Western District of Oklahoma. From April 2004 through May 2007, Mr. Layton served as the Director of Financial Reporting for Chickasaw Holding Company, a telecommunications service company. He began his career in public accounting with Finley & Cook PLLC. Mr. Layton has a Bachelor of Science degree in Accounting from the University of Central Oklahoma. Mr. Layton is a Certified Public Accountant.
Aaron Gaydosik has agreed to serve as a member of our board of directors and is expected to join our board of directors prior to the closing of this offering. Mr. Gaydosik has served as Chief Financial Officer of Gulfport since August 2014. From July 2013 until joining Gulfport, Mr. Gaydosik served as Vice President of Finance at Kodiak Oil & Gas Corp., an independent energy company with operations focused primarily in the Williston Basin of North Dakota. From May 2007 through July 2013, Mr. Gaydosik held various positions of increasing levels of responsibility at Credit Suisse, most recently as a Director in its Oil and Gas Group, focused on capital markets and advisory transactions primarily for exploration and production companies. His prior investment banking experience also includes two years in the energy group at Wachovia Securities. Mr. Gaydosik holds a Bachelor of Business Administration in Finance from Southern Methodist University and a Masters of Business Administration from the University of Chicago Booth School of Business. We believe Mr. Gaydosik’s experience with financial matters in the oil and gas industry qualifies him for service as a member of our board of directors.
Arthur Smith has agreed to serve as a member of our board of directors and is expected to join our board of directors prior to the closing of this offering. Mr. Smith founded Triple Double Advisors, LLC, an investment advisory firm focusing on the energy industry, in 2007 and is its President and Managing Member, a position he has held since August 2007. Mr. Smith was Chairman and Chief Executive Officer of John S. Herold, Inc., an independent energy research firm, from 1984 until the firm was merged into IHS, Inc. in 2007. Prior to that, Mr. Smith was an energy equity analyst with Oppenheimer & Co., Inc. (1982-1984), The First Boston Corp. (1979-1982) and Argus Research Corp. (1976-1979). Since September 2015, Mr. Smith has served on the board of independent crude storage operator, Fairway Energy. Mr. Smith served on the board of directors of Plains All American GP LLC, the general partner of Plains All America Pipeline, L.P., from 1999 until 2010. Mr. Smith is also a former director of PAA Natural Gas Storage, L.P. from April 2010 until December 2013 and Pioneer Southwest Energy Partners, L.P. from May 2008 until December 2013. Mr. Smith is a former director of Pioneer Natural Resources (1993-1998), Cabot Oil & Gas Corporation (1996-2000) and Evergreen Resources, Inc. (2000-2004), and was a past appointee to the National Petroleum Council. Mr. Smith holds a Bachelor of Administration from Duke University and a Masters of Business Administration from New York University’s Stern School of Business. In addition, he holds the Certified Financial Analyst designation. Mr. Smith is a Fellow and active in the National Association of Corporate Directors. We believe that Mr. Smith’s experience with financial matters in the oil and gas industry qualifies him for service as a member of our board of directors.
André Weiss has agreed to serve as a member of our board of directors and is expected to join our board of directors prior to the closing of this offering. Since February 2013, Mr. Weiss has served as an independent legal consultant to several individuals and firms, providing advice with respect to financial, real estate investment, bio-tech, corporate governance and litigation matters. From August 1986 until January 2013, Mr. Weiss was a partner at Schulte Roth & Zabel LLP in the firm’s business transaction group, representing hedge funds, private equity funds, banks and other financial institutions and real estate and other businesses. Mr. Weiss’ experience also includes an associate position at Shearman & Sterling LLP from 1979 until 1986 and his tenure as a staff attorney at the SEC’s Division of Market Regulation from 1977 until 1979. Mr. Weiss has served as a member of the supervisory boards of BAWAG P.S.K., a privately held Austrian bank, and its parent BAWAG Holding GMBH, and as a consultant of BAWAG Holding GMBH, in each case since February 2013. Mr. Weiss holds a Bachelor of Arts from the New York University and a Doctor of Jurisprudence from the Syracuse University College of Law. We believe Mr. Weiss’ experience advising corporations and financial institutions on various legal matters, including corporate governance, qualifies him for service as a member of our board of directors.
Our Board of Directors and Committees
Upon completion of this offering, our board of directors will consist of six directors, three of whom will satisfy the independence requirements of current SEC rules and The NASDAQ Global Market listing standards.
96
Our certificate of incorporation provides that the terms of office of the directors are one year from the time of their election until the next annual meeting of stockholders or until their successors are duly elected and qualified.
Our certificate of incorporation provides that the authorized number of directors will generally be not less than five nor more than thirteen, and the exact number of directors will be fixed from time to time exclusively by the board of directors pursuant to a resolution adopted by a majority of the whole board. In addition, our certificate of incorporation and our bylaws provide that, in general, vacancies on the board may be filled by a majority of directors in office, although less than a quorum.
Prior to the closing of this offering, we will enter into an investor rights agreement with Gulfport in which Gulfport, among other things, will be granted the right to nominate one of our directors for so long as Gulfport owns 10% or more of our outstanding common stock. Mr. Gaydosik will be Gulfport’s initial director nominee.
Our board of directors will establish an audit committee in connection with this offering whose functions include the following:
| • | assist the board of directors in its oversight responsibilities regarding the integrity of our financial statements, our compliance with legal and regulatory requirements, the independent accountant’s qualifications and independence and our accounting and financial reporting processes of and the audits of our financial statements; |
| • | prepare the report required by the SEC for inclusion in our annual proxy or information statement; |
| • | appoint, retain, compensate, evaluate and terminate our independent accountants; |
| • | approve audit and non-audit services to be performed by the independent accountants; |
| • | review and approve related party transactions; and |
| • | perform such other functions as the board of directors may from time to time assign to the audit committee. |
The specific functions and responsibilities of the audit committee will be set forth in the audit committee charter. Upon completion of this offering, our audit committee will consist of three directors who satisfy the independence requirements of current SEC rules and The NASDAQ Global Market listing standards, one of whom will qualify as an audit committee financial expert as defined under these rules and listing standards, and the other members of our audit committee will satisfy the financial literacy standards for audit committee members under these rules and listing standards.
Pursuant to our bylaws, our board of directors may, from time to time, establish other committees to facilitate the management of our business and operations. Because we are considered to be controlled by Wexford under The NASDAQ Global Market rules, we are eligible for exemptions from provisions of these rules requiring a majority of independent directors, nominating and corporate governance and compensation committees composed entirely of independent directors and written charters addressing specified matters. We may elect to take advantage of these exemptions. In the event that we cease to be a controlled company within the meaning of these rules, we will be required to comply with these provisions after the specified transition periods.
Although we will be eligible for an exemption from the compensation committee requirements under The NASDAQ Global Market rules, we intend to establish a compensation committee composed of at least two independent directors in connection with this offering.
Director Compensation
To date, none of our directors has received compensation for services rendered as a board member. Members of our board of directors who are also officers or employees of our company will not receive compensation for their
97
services as directors. After the completion of this offering, we will pay our non-employee directors an annual cash retainer of $47,500 plus an additional annual payment of $15,000 to the chairperson and $10,000 for each other member of the audit committee and $10,000 for the chairperson and $5,000 for each other member of each other committee. Our non-employee directors will also receive a fee of $1,000 for attending each in-person meeting of the board of directors or its committees and $500 for attending each telephone meeting. In addition, our non-employee directors will receive an annual equity award in the amount of $100,000 vesting in three installments, with the initial installment vesting at the time of grant and the remaining installments vesting on the first and second anniversary dates of grant. Our directors will be reimbursed for all ordinary and necessary expenses incurred in the conduct of our business.
In connection with this offering, we intend to implement an equity incentive plan. Under the plan, non-employee directors will be granted restricted stock units, which will vest in three equal annual installments beginning on the date of grant.
Compensation Committee Interlocks and Insider Participation
We do not currently have a compensation committee. None of our executive officers serves, or has served during the past year, as a member of the board of directors or compensation committee of any other company that has one or more executive officers serving as a member of our board of directors or compensation committee.
Executive Compensation
Summary of Compensation for Our Named Executive Officers
The following table shows the compensation of all individuals serving as our principal executive officer during 2015 and of our two other most highly compensated executive officers serving as of December 31, 2015, whose total compensation exceeded $100,000 for the fiscal year ended December 31, 2015.
| Year | Salary | Bonus(1) | All Other Compensation(2) |
Total | ||||||||||||||||
| Marc McCarthy, Chairman(3) |
2015 | $ | 366,346 | $ | - | $ | 8,913 | $ | 375,259 | |||||||||||
| Arty Straehla, Chief Executive Officer(4) |
2015 | $ | - | $ | - | $ | - | $ | - | |||||||||||
| Mark Layton, Chief Financial Officer |
2015 | $ | 226,731 | $ | 222,500 | $ | 7,456 | $ | 456,687 | |||||||||||
| (1) | Consists of a discretionary bonus. |
| (2) | Consists of $8,913 attributable to our matching contributions to Mr. McCarthy’s 401(k) account. Consists of $7,456 attributable to our matching contributions to Mr. Layton’s 401(k) account. |
| (3) | During 2015, Mr. McCarthy acted as the principal executive officer and served as a director of the general partner of Mammoth Partners. During 2015, he did not receive any additional compensation for his role as a director. |
| (4) | Mr. Straehla joined us as our Chief Executive Officer in February of 2016 and did not receive any compensation from us in 2015. |
Employment Agreements
In February 2016, we entered into an oral employment agreement with Arty Straehla, our Chief Executive Officer. Mr. Straehla’s annual base salary is $400,000, which can be increased from time to time by the board of directors or the compensation committee. Upon completion of this offering, Mr. Straehla’s annual base salary will be increased to $600,000 and he will receive an award of 250,000 restricted stock units that will vest in three substantially equal annual installments beginning on the first anniversary of the grant. Subject to Mr. Straehla’s achievement of certain performance goals to be determined by the board of directors or the compensation
98
committee, Mr. Straehla will be eligible to receive bonuses. Mr. Straehla is entitled to participate in any life and medical insurance plans and other similar plans that we establish from time to time for our executive employees. Mr. Straehla’s employment with us is terminable by either party.
In September 2014, we entered into an oral employment agreement with Mark Layton, our Chief Financial Officer. Mr. Layton’s initial annual base salary was $225,000. As a result of industry conditions, Mr. Layton’s annual base salary was reduced to $202,500 in September 2015. Upon completion of this offering, Mr. Layton’s annual base salary will be increased to $300,000. Subject to Mr. Layton’s achievement of certain performance goals to be determined by the board of directors or the compensation committee, Mr. Layton will be eligible to receive a target annual bonus of 75% of his annual base salary, which bonus could exceed such target in the discretion of the board of directors. In 2015, Mr. Layton was granted an annual bonus exceeding the target level in consideration of Mr. Layton’s contribution to our performance. Upon the completion of this offering, Mr. Layton will receive a one-time cash bonus of $300,000 and will be entitled to receive annual equity incentive awards equal to 100% of his annual base salary at the time of the agreement, which will vest in substantially equal installments over a four-year period. Based on his salary at the time of the agreement, the aggregate fair value of Mr. Layton’s cash bonus and initial equity award to which Mr. Layton would be entitled upon completion of this offering would be $525,000. Mr. Layton is entitled to participate in any life and medical insurance plans and other similar plans that we establish from time to time for our executive employees. Mr. Layton’s employment with us is terminable by either party.
2016 Equity Incentive Plan
Prior to the completion of this offering, we did not have any option or other equity incentive plan and there are no options, restricted units or other equity awards outstanding for any of our named executive officers. Prior to this offering, we intend to implement our equity incentive plan as described below. The equity incentive plan is intended to enable us to obtain and retain the services of employees, directors and consultants who will contribute to our long-term success and to provide an additional incentive to our management and directors following the completion of this offering to continue to grow our business and enhance the share value for our stockholders.
Eligible award recipients are employees, consultants and directors of our company and its affiliates. Incentive stock options may be granted only to our employees. Awards other than incentive stock options may be granted to employees, consultants and directors. The shares that may be issued pursuant to awards consist of our authorized but unissued common stock, and the maximum aggregate amount of such common stock which may be issued upon exercise of all awards under the plan, including incentive stock options, may not exceed shares, subject to adjustment to reflect certain corporate transactions or changes in our capital structure. At any time after the Company is subject to the deduction limitations under Section 162(m) of the Code, the maximum number of shares of common stock issuable under our equity incentive plan to any one participant during a calendar year shall not exceed shares.
We anticipate granting options and restricted stock units to employees and certain non-employee directors under the plan upon completion of this offering in the amount to be determined by the compensation committee. However, the plan permits additional types of grants and awards, including restricted stock, performance awards and stock appreciation rights.
Share Reserve. The aggregate number of shares of common stock initially authorized for issuance under the plan is shares. However, (i) shares covered by an award that expires or otherwise terminates without having been exercised in full and (ii) shares that are forfeited to, or repurchased by, us pursuant to a forfeiture or repurchase provision under the plan may return to the plan and be available for issuance in connection with a future award.
Administration. Our board of directors (or our compensation committee or any other committee of the board of directors as may be appointed by our board of directors from time to time) administers the plan. Among
99
other responsibilities, the plan administrator selects participants from among the eligible individuals, determines the type of award and the number of shares that will be subject to each award and determines the terms and conditions of each award, including methods of payment, vesting schedules and limitations and restrictions on awards. The board may amend, suspend, or terminate the plan at any time. Amendments will not be effective without stockholder approval if stockholder approval is required by applicable law or stock exchange requirements. Unless terminated earlier, our equity incentive plan will terminate in August 2026.
Stock Options. Incentive and nonstatutory stock options may be granted pursuant to incentive and nonstatutory stock option agreements. Employees, directors and consultants may be granted nonstatutory stock options, but only employees may be granted incentive stock options. The plan administrator determines the exercise price of a stock option, provided that the exercise price of a stock option cannot be less than 100% (and in the case of an incentive stock option granted to a more than 10% stockholder, 110%) of the fair market value of our common stock on the date of grant, except when assuming or substituting options in limited situations such as an acquisition. Unless otherwise specified by the plan administrator in the terms of any option agreement, options granted under the plan vest ratably over a five-year period and have a term of ten years (five years in the case of an incentive stock option granted to a more than 10% stockholder), unless specified otherwise by the plan administrator in the option agreement.
Acceptable consideration for the purchase of common stock issued upon the exercise of a stock option will be determined by the plan administrator and may include (i) cash or check, (ii) a broker-assisted cashless exercise, (iii) the tender of common stock previously owned by the optionee, (iv) stock withholding and (v) other legal consideration approved by the plan administrator, such as exercise with a full recourse promissory note (not applicable for directors and executive officers).
Unless the plan administrator provides otherwise (solely with respect to intervivos transfers to certain family members and estate planning vehicles), nonstatutory options generally are not transferable except by will or the laws of descent and distribution. An optionee may designate a beneficiary, however, who may exercise the option following the optionee’s death. Incentive stock options are not transferable except by will or the laws of descent and distribution.
Restricted Awards. Restricted awards are awards of either actual shares of common stock (e.g., restricted stock awards), or of hypothetical share units (e.g., restricted stock units) having a value equal to the fair market value of an identical number of shares of common stock, that will be settled in the form of shares of common stock upon vesting or other specified payment date, and which may provide that such restricted awards may not be sold, transferred, or otherwise disposed of for such period as the plan administrator determines. The purchase price and vesting schedule, if applicable, of restricted awards are determined by the plan administrator. A restricted stock unit is similar to a restricted stock award except that participants holding restricted stock units do not have any stockholder rights until the stock unit is settled with shares. Stock units represent an unfunded and unsecured obligation for us and a holder of a stock unit has no rights other than those of a general creditor.
Performance Awards. Performance awards entitle the recipient to vest in or acquire shares of common stock, or hypothetical share units having a value equal to the fair market value of an identical number of shares of common stock that will be settled in the form of shares of common stock upon the attainment of specified performance goals. Performance awards may be granted independent of or in connection with the granting of any other award under the plan. Performance goals will be established by the plan administrator based on one or more business criteria specified in the plan that apply to the plan participant, a business unit, or our company and our affiliates. Performance goals will be objective and will be intended to meet the requirements of Section 162(m) of the Code. Performance goals must be determined prior to the time 25% of the service period has elapsed but not later than 90 days after the beginning of the service period. No payout will be made on a performance award granted to a named executive officer unless all applicable performance goals and service requirements are achieved. Performance awards may not be sold, assigned, transferred, pledged or otherwise encumbered and terminate upon the termination of the participant’s service to us or our affiliates.
100
Stock Appreciation Rights. Stock appreciation rights may be granted independent of or in tandem with the granting of any option under the plan. Stock appreciation rights are granted pursuant to stock appreciation rights agreements. The exercise price of a stock appreciation right granted independent of an option is determined by the plan administrator, but will be no less than 100% of the fair market value of our common stock on the date of grant. The exercise price of a stock appreciation right granted in tandem with an option is the same as the exercise price of the related option. Upon the exercise of a stock appreciation right, we will pay the participant an amount equal to the product of (i) the excess of the per share fair market value of our common stock on the date of exercise over the strike price, multiplied by (ii) the number of shares of common stock with respect to which the stock appreciation right is exercised. Payment will be made in cash, delivery of stock, or a combination of cash and stock as deemed appropriate by the plan administrator.
Adjustments in capitalization. In the event that there is a specified type of change in our common stock without the receipt of consideration by us, such as pursuant to a merger, consolidation, reorganization, recapitalization, reincorporation, stock dividend, dividend in property other than cash, stock split, liquidating dividend, combination of shares, exchange of shares, change in corporate structure or other transaction, appropriate adjustments will be made to the various limits under, and the share terms of, the plan including (i) the number and class of shares reserved under the plan, (ii) the maximum number of stock options and stock appreciation rights that can be granted to any one person in a calendar year and (iii) the number and class of shares and exercise price, strike price, or purchase price, if applicable, of all outstanding stock awards.
Corporate Transactions. In the event of a change in control transaction, or a corporate transaction such as a dissolution or liquidation of our company, or any corporate separation or division, including, but not limited to, a split-up, a split-off or a spin-off, or a sale in one or a series of related transactions, of all or substantially all of the assets of our company or a merger, consolidation, or reverse merger in which we are not the surviving entity, then all outstanding stock awards under the plan may be assumed, continued or substituted for by any surviving or acquiring entity (or its parent company), or may be cancelled either with or without consideration for the vested portion of the awards, all as determined by the plan administrator. In the event an award would be cancelled without consideration paid to the extent vested, the award recipient may exercise the award in full or in part for a period of ten days.
401(k) Plan
We have a retirement savings plan in which our named executive officers currently participate. The retirement plan is a tax qualified 401(k) plan that covers all eligible employees including the named executive officers. Prior to October 9, 2015, we made a safe harbor contribution equal to 3% of each eligible employee’s gross annual compensation for the prior calendar year, subject to certain limitations provided by our 401(k) plan and Internal Revenue Service regulations. The safe harbor contributions were made regardless of employee’s deferrals into the plan. All safe harbor contributions made by us on behalf of an eligible employee were 100% vested when contributed. We also have the ability to make an additional, discretionary contribution that is allocated based on each eligible employee’s gross annual compensation for the prior calendar year, but did not make any discretionary contributions in 2015. Effective October 9, 2015, the plan no longer provides for a safe harbor qualified non-elective contributions by us, and we suspended making such safe harbor contributions on behalf of eligible employees beginning on such date.
Limitations on Liability and Indemnification of Officers and Directors
Certificate of Incorporation and Bylaws
Our certificate of incorporation provides that no director shall be personally liable to us or any of our stockholders for monetary damages resulting from breaches of their fiduciary duty as directors, except to the extent such limitation on or exemption from liability is not permitted under the Delaware General Corporation Law, or DGCL. The effect of this provision of our certificate of incorporation is to eliminate our rights and those of our stockholders (through stockholders’ derivative suits on our behalf) to recover monetary damages against a
101
director for breach of the fiduciary duty of care as a director, including breaches resulting from negligent or grossly negligent behavior, except, as restricted by the DGCL:
| • | for any breach of the director’s duty of loyalty to the company or its stockholders; |
| • | for acts or omissions not in good faith or that involve intentional misconduct or a knowing violation of law; |
| • | in respect of certain unlawful dividend payments or stock redemptions or repurchases; and |
| • | for any transaction from which the director derives an improper personal benefit. |
This provision does not limit or eliminate our rights or the rights of any stockholder to seek non-monetary relief, such as an injunction or rescission, in the event of a breach of a director’s duty of care.
Our certificate of incorporation also provides that we will, to the fullest extent permitted by Delaware law, indemnify our directors and officers against losses that they may incur in investigations and legal proceedings resulting from their service.
Our bylaws include provisions relating to advancement of expenses and indemnification rights consistent with those provided in our certificate of incorporation. In addition, our bylaws provide:
| • | for a right of indemnitee to bring a suit in the event a claim for indemnification or advancement of expenses is not paid in full by us within a specified period of time; and |
| • | permit us to purchase and maintain insurance, at our expense, to protect us and any of our directors, officers and employees against any loss, whether or not we would have the power to indemnify that person against that loss under Delaware law. |
Indemnification Agreements
We will enter into indemnification agreements with each of our current directors and executive officers effective upon the closing of this offering. These agreements require us to indemnify these individuals to the fullest extent permitted under Delaware law against liabilities that may arise by reason of their service to us, and to advance expenses incurred as a result of any proceeding against them as to which they could be indemnified. We also intend to enter into indemnification agreements with our future directors and executive officers.
Liability Insurance
We intend to provide liability insurance for our directors and officers, including coverage for public securities matters. There is no pending litigation or proceeding involving any of our directors, officers or employees for which indemnification from us is sought. We are not aware of any threatened litigation that may result in claims for indemnification from us.
102
CERTAIN RELATIONSHIPS AND RELATED PARTY TRANSACTIONS
Review and Approval of Related Party Transactions
We do not currently have a written policy regarding the review and approval of related party transactions, but intend to implement such a policy in connection with, and prior to the completion of, this offering. In connection with this offering, we will establish an audit committee consisting solely of independent directors whose functions will be set forth in the audit committee charter. We anticipate that one of the audit committee’s functions will be to review and approve all relationships and transactions in which we and our directors, director nominees and executive officers and their immediate family members, as well as holders of more than 5% of any class of our voting securities and their immediate family members, have a direct or indirect material interest. We anticipate that such policy will be a written policy included as part the audit committee charter that will be implemented by the audit committee and in the Code of Business Conduct and Ethics that our board of directors will adopt prior to the completion of this offering.
Historically, the review and approval of related party transactions have been the responsibility of our management. The terms of the transactions and agreements disclosed in this section were determined by and among affiliated entities and, consequently, are not the result of arm’s length negotiations. Although our management believes that the terms of the related party transactions described below are reasonable, it is possible that we could have negotiated more favorable terms for such transactions with unrelated third parties.
Our management will continue to review and approve related party transactions until the adoption of the policy regarding the review and approval of such transactions by the audit committee, which we intend to adopt in connection with, and prior to the completion of, this offering.
Registration Rights and Investor Rights Agreements
Prior to the closing of this offering, we will enter into a registration rights agreement with Mammoth Holdings, pursuant to which Mammoth Holdings and its affiliates will have certain demand and “piggyback” registration rights. Further, prior to the closing of this offering, we will enter into an investor rights agreement with Gulfport in which Gulfport will be granted (i) certain demand and “piggyback” registration rights, (ii) the right to nominate one of our directors for so long as Gulfport owns 10% or more of our outstanding common stock and (iii) certain information rights. Our registration rights agreement with Rhino will provide for “piggyback” registration rights. For more information regarding these rights, see “Management” and “Shares Eligible for Future Sale—Registration Rights.”
Advisory Services Agreement
Prior to the closing of this offering, we will enter into an advisory services agreement with Wexford under which Wexford will provide us with general financial and strategic advisory services related to our business in return for an annual fee of $500,000, plus reasonable out-of-pocket expenses. This agreement has a term of two years commencing on the completion of this offering. The agreement will continue for additional one-year periods unless terminated in writing by either party at least ten days prior to the expiration of the then current term. The agreement may be terminated at any time by either party upon 30 days’ prior written notice. In the event we terminate the agreement, we are obligated to pay all amounts due through the remaining term of the agreement. In addition, in this agreement we have agreed to pay Wexford to-be-negotiated market-based fees approved by our independent directors for such services as may be provided by Wexford at our request in connection with future acquisitions and divestitures, financings or other transactions in which we may be involved. The services provided by Wexford under the advisory services agreement will not extend to our day-to-day business or operations. In this agreement, we have agreed to indemnify Wexford and its affiliates from any and all losses arising out of or in connection with the agreement except for losses resulting from Wexford’s or its
103
affiliates’ gross negligence or willful misconduct. In the event we are dissatisfied with the services provided by Wexford, our only remedy against Wexford will be to terminate the agreement.
Other Agreements with Affiliates
Services and Products We Provide to Affiliates
In September 2014, effective October 1, 2014, Gulfport entered into an amended and restated master services agreement with our wholly-owned subsidiary, Pressure Pumping, for pressure pumping services. Pursuant to this agreement, Pressure Pumping has agreed to provide pressure pumping, stimulation and related completion and rework services to Gulfport, dedicating two spreads and related equipment for the performance of these services. Gulfport has agreed to pay Pressure Pumping a monthly service fee plus the associated costs of the services provided. Gulfport and Pressure Pumping have each agreed to maintain insurance at certain minimum thresholds. This agreement has a term of four years ending on September 30, 2018 and includes, among others, confidentiality and non-solicitation provisions. This agreement may be terminated in the event of a covenant breach by either party on 45 days’ written notice and a failure to cure. Pressure Pumping may also terminate in the event of payment default by Gulfport. Additionally, Gulfport can, without liability, countermand any work order given to us at any time before we begin such work. If the work had already begun, Gulfport could then still cancel the service at any time, being liable only for the value of the work performed prior to the cancellation. We can terminate the master service agreement by giving Gulfport written notice prior to receiving a notification from Gulfport to perform a specific service. During the first quarter of 2016, due to the weakness in natural gas commodity pricing and other factors, Gulfport suspended our pressure pumping services under this agreement and entered into an amendment to this agreement with us that adjusted the amount of service fees that would be otherwise payable to us during this period. Under the amendment, the services that were suspended during the first quarter of 2016, and the related fees, are to be performed and paid for during the second and third quarters of 2016. For the six months ended June 30, 2016, we recognized $38.2 million in revenue from Gulfport under this agreement. As of June 30, 2016, Gulfport owed us $24.0 million. For the years ended December 31, 2015 and 2014, we recognized revenue from Gulfport of approximately $124.4 million and $12.7 million, respectively, and, as of December 31, 2015 and December 31, 2014, Gulfport owed us approximately $16.3 million and $25.6 million, respectively, for such services.
In September 2014, effective October 1, 2014, Gulfport entered into a sand supply agreement, as amended on November 3, 2015, with our wholly-owned subsidiary, Muskie Proppant. Pursuant to this agreement, Muskie Proppant has agreed to sell and deliver, and Gulfport has agreed to purchase, specified annual and monthly amounts of proppant sand, subject to certain exceptions specified in the agreement, and pay certain costs and expenses. Failure by either Muskie Proppant or Gulfport to deliver or accept the minimum monthly amount results in damages calculated per ton based on the difference between the monthly obligation amount and the amount actually delivered or accepted, as applicable. In addition, failure to pick up the sand on a timely basis from the designated facility will lead to demurrage charges payable by Gulfport. If Gulfport fails to make payments when due, or Muskie Proppant fails to deliver the required amounts of sand over three consecutive months, the other party can terminate the sand supply agreement. The sand supply agreement has a term ending on September 30, 2018 and includes, among others, confidentiality and non-solicitation provisions. We recognized revenue from Gulfport under this agreement of approximately $11.2 million and $21.5 million for the six months ended June 30, 2016 and June 30, 2015, respectively. As of June 30, 2016, Gulfport owed us approximately $7.3 million. For the years ended December 31, 2015 and 2014, we recognized revenue from Gulfport of approximately $38.2 million and $3.1 million, respectively, and, as of December 31, 2015 and December 31, 2014, Gulfport owed us additional amounts of approximately $6.8 million and $3.1 million, respectively, for such services.
We provide remote accommodation and food services to Grizzly Oil Sands ULC, or Grizzly, an entity owned approximately 75% by affiliates of Wexford and approximately 25% by Gulfport. Since June 25, 2012, these services have been provided to Grizzly pursuant to a written agreement with an initial term of one year. The agreement automatically renews for successive one-year terms unless terminated by either party by giving
104
written notice of such termination to the other party at least 30 days prior to the expiration of the then-current term. We recognized revenue from Grizzly of approximately $1,000 for the six months ended June 30, 2016. For the years ended December 31, 2015 and 2014, we recognized revenue from Grizzly of approximately $0.9 million and $3.8 million, respectively, and, as of December 31, 2015 and December 31, 2014, Grizzly owed us additional amounts of approximately $1,000 and $0.9 million, respectively, for such services.
Our wholly-owned subsidiary, Panther Drilling, performs drilling services for Gulfport pursuant to a master service agreement dated February 22, 2013. The master service agreement may be terminated by Panther Drilling at any time prior to the receipt of notification by Gulfport to perform work pursuant to the agreement. Gulfport may terminate the master service agreement at any time by giving written notice to Panther Drilling. The master service agreement does not obligate Gulfport to call upon Panther Drilling to perform any work under the master service agreement, and Panther Drilling is not obligated to accept any work requests from Gulfport. The designation of any work to be performed by Panther Drilling and the cessation of such work is at the sole discretion of Gulfport. For the six months ended June 30, 2016, Panther Drilling recognized revenue of approximately $1.2 million for services performed for Gulfport and, as of June 30, 2016, Gulfport owed Panther Drilling $0.7 million. For the years ended December 31, 2015 and 2014, Panther Drilling recognized revenue of approximately $3.7 million and $8.3 million, respectively, for services performed for Gulfport and, as of December 31, 2015 and 2014, Gulfport owed Panther Drilling $1.0 million and $2.4 million, respectively, for work performed under the master service contract.
Our wholly-owned subsidiary, Redback Energy Services, performs completion and production services for Gulfport pursuant to a master service agreement dated June 11, 2012. The master service agreement may be terminated by Redback Energy Services at any time prior to the receipt of notification by Gulfport to perform work pursuant to the agreement. Gulfport may terminate the master service agreement at any time by giving written notice to Redback Energy Services. The master service agreement does not obligate Gulfport to call upon Redback Energy Services to perform any work under the master service agreement, and Redback Energy Services is not obligated to accept any work requests from Gulfport. As of June 30, 2016, Gulfport owed us approximately $4,000. For the years ended December 31, 2015 and 2014, we recognized revenue from Gulfport of approximately $2.6 million and $1.5 million, respectively, and, as of December 31, 2015 and December 31, 2014, Gulfport owed us additional amounts of approximately $0.5 million and $0.5 million, respectively, for such services.
Effective January 1, 2013, our wholly-owned subsidiary, Bison Drilling, entered into a master field services agreement with Diamondback E&P pursuant to which Bison Drilling may, from time to time, provide services or sell or lease specified goods to Diamondback E&P in connection with its business activities. This agreement, which may be terminated at the option of either party upon 30 days’ notice, does not obligate Diamondback E&P to issue any order or accept any offers from Bison Drilling for its services. On February 21, 2013, this master field services agreement was amended to provide a revised rate schedule for services. Additionally, effective January 1, 2013, Bison Drilling entered into a master drilling agreement with Diamondback E&P pursuant to which Bison Drilling may provide rigs to Diamondback E&P to be used in connection with Diamondback E&P’s exploration and development of its oil and natural gas properties. The master drilling agreement may be terminated at the option of either party on 30 days’ notice. If Diamondback E&P requires rigs for vertical wells within the Permian Basin, then Diamondback E&P must order such services from Bison Drilling and Bison Drilling must provide such services. However, the master drilling agreement does not obligate Diamondback E&P to issue any order to Bison Drilling for vertical well drilling services and it does not obligate Bison Drilling to accept an order from Diamondback E&P for a vertical rig if two of its rigs are then obligated to perform other drilling services and such drilling services have not been completed. Bison Drilling recognized revenue of approximately $3.2 million for services for the year ended December 31, 2014 and, as of December 31, 2014, there were no receivables outstanding under this agreement. Diamondback E&P is a wholly-owned subsidiary of Diamondback Energy, Inc., or Diamondback. A Wexford partner is the Chairman of the Board of Diamondback. Bison Drilling has not provided any services to Diamondback E&P since 2014.
105
Prior to our acquisition of Pressure Pumping in November 2014, Muskie Proppant sold natural sand proppant to Pressure Pumping. Prior to the acquisition, Muskie Proppant recognized revenue of approximately $6.2 million from Pressure Pumping for services during the year ended December 31, 2014.
Effective May 16, 2013, Muskie Proppant entered into a master services agreement with Diamondback E&P, whereby Muskie Proppant sells custom natural sand proppant to Diamondback E&P. This agreement, which may be terminated at the option of either party on 30 days’ notice, does not obligate Diamondback E&P to issue any order or accept any offers from Muskie Proppant for sand proppant. Muskie Proppant did not sell any sand proppant to Diamondback E&P under this agreement during the six months ended June 30, 2016 or during the years ended December 31, 2015 or 2014.
Effective September 9, 2013, Panther Drilling entered into a master service agreement with Diamondback E&P pursuant to which Panther Drilling provides drilling and other services to Diamondback E&P. This master service agreement is terminable by either party on 30 days’ prior written notice, although neither party will be relieved of its respective obligations arising from work performed prior to the termination of the master service agreement. The master service agreement does not obligate Diamondback E&P to issue any order or accept any offers from Panther Drilling for its directional drilling or other services. In the third quarter 2013, Diamondback E&P began using Panther Drilling’s directional drilling services. For the year ended December 31, 2014, Panther Drilling recognized revenue of approximately $0.2 million and, as of December 31, 2014, Diamondback E&P owed Panther Drilling approximately $1,000 for work performed for services performed. Panther Drilling has not provided any services to Diamondback E&P since 2014.
Taylor Frac LLC, or Taylor, an entity owned 75% by affiliates of Wexford and 25% by Gulfport, has purchased natural sand proppant from Muskie Proppant. Natural sand proppant is sold to Taylor at a market-based per ton arrangement on an as-needed basis. We recognized revenue from Taylor of approximately $2.5 million for the six months ended June 30, 2016. As of June 30, 2016, there were no receivables outstanding. For the years ended December 31, 2015 and 2014, we recognized revenue from Taylor of approximately $0.3 million and $0.1 million, respectively, and, as of December 31, 2015 and December 31, 2014, Taylor owed us approximately $0.1 million and $0.1 million, respectively, for such purchases.
We perform contract land and directional drilling services for El Toro pursuant to a master service agreement dated February 22, 2013. For the six months ended June 30, 2016, we recognized revenue of approximately $0.7 million for such services and, as of June 30, 2016, there were no receivables outstanding. For the years ended December 31, 2015 and 2014, we recognized revenue of $0.9 million and $1.0 million, respectively, and, as of December 31, 2015 and December 31, 2014, there were no receivables outstanding under this agreement. El Toro is an entity controlled by Wexford.
Redback Coil Tubing provides services to El Toro pursuant to a master service agreement. For the six months ended June 30, 2016, we recognized revenue of approximately $0.3 million for these services and as of June 30, 2016, were owed $0.1 million.
Redback Energy Services provides services to El Toro pursuant to a master service agreement. For the six months ended June 30, 2016, we recognized revenue of approximately $0.3 million for these services and as of June 30, 2016, were owed $0.2 million. For the year ended December 31, 2015, we recognized revenue of $0.2 million, and, as of December 31, 2015, there were no receivables outstanding under this agreement.
On October 17, 2013, our wholly-owned subsidiary Bison Trucking, entered into a master service contract with Diamondback E&P pursuant to which Bison Trucking may, from time to time, provide services or sell or lease goods, equipment or facilities to Diamondback E&P in connection with its business activities. This agreement, which may be terminated at the option of either party on 30 days’ notice, does not obligate Diamondback E&P to issue any order or accept any offers from Bison Trucking for its services. For the year ended December 31, 2014, we recognized revenue of $0.2 million and, as of December 31, 2014, were owed
106
$10,000 for services performed under this agreement. Bison Trucking has not provided any services to Diamondback E&P since 2014.
Mammoth Partners and Pressure Pumping provide certain management, administrative and treasury functions to Stingray Cementing, LLC, an affiliate of both Wexford and Gulfport. As of June 30, 2016 and December 31, 2015 and 2014, we were owed $0.3 million, $0.2 million and $0.9 million, respectively, under these arrangements. Additionally, we provided iron inspections to Stingray Cementing, LLC. For the year ended December 31, 2015, we recognized revenue from Stingray Cementing, LLC of approximately $9,000 for such services.
Mammoth Partners and Pressure Pumping provide certain management, administrative and treasury functions to Stingray Energy Services, LLC, or Energy Services, an affiliate of both Wexford and Gulfport. As of June 30, 2016 and December 31, 2015 and 2014, we were owed $0.6 million, $0.3 million and $1.3 million, respectively, under these arrangements.
Mammoth Partners provides certain management, administrative and treasury functions to Taylor. As of June 30, 2016 and December 31, 2015 and 2014, we were owed $0.7 million, $0.4 million and $0.2 million, respectively, under these arrangements.
Services and Products Our Affiliates Provide to Us
Everest Operations Management LLC, or Everest, an affiliate of Wexford, has historically provided office space and certain technical, administrative and payroll services to us, and we have reimbursed Everest in amounts determined by it based on estimates of the amount of office space provided and the amount of employees’ time spent performing services for us. The reimbursement amounts were determined based upon underlying salary costs of employees performing company-related functions, payroll, revenue or headcount relative to other companies managed by Everest, or specifically identified invoices processed, depending on the nature of the cost. Additionally, from time to time, we pay for goods and services on behalf of Everest, and pay for goods and services on our behalf. For the six months ended June 30, 2016, we incurred $0.1 million in expenses and, as of June 30, 2016, owed approximately $30,000, under these arrangements. For the years ended December 31, 2015 and 2014, we incurred total costs under these arrangements of $0.5 million and $4.4 million, respectively, and, as of December 31, 2015 and 2014, owed approximately $29,000 and $0.2 million, respectively.
Bison Trucking leases office space from Diamondback in Midland, Texas. The office space is leased through early 2017. Under the lease, Bison Trucking pays for the monthly rental cost, insurance and property taxes amounting to a total of approximately $14,000 per month. The rental portion of this monthly rental cost is escalated by 2% per annum effective April 1 of each year. For the six months ended June 30, 2016, we incurred approximately $0.1 million in expenses under the terms of the lease agreement and, as of June 30, 2016, had no payables outstanding. For the years ended December 31, 2015 and 2014, we recognized expense of $0.2 million and $0.1 million, respectively, as of December 31, 2015 and 2014, we owed Diamondback $12,000 and $10,000, respectively, under this agreement.
Taylor has historically sold natural sand proppant to Muskie Proppant and Pressure Pumping. Natural sand proppant is sold to Muskie Proppant at a market-based per ton arrangement on an as-needed basis to supplement sand provided by our facility (when in operation) if any orders placed by our customers are not able to be readily fulfilled, either because of volume or specific grades of sand requested. For the six months ended June 30, 2016, we incurred $13.9 million in expenses and, as of June 30, 2016, owed $11.2 million under these arrangements. For the years ended December 31, 2015 and 2014, we incurred total costs under these arrangements of $23.6 million and $1.9 million, respectively, and, as of December 31, 2015 and 2014, owed $6.7 million and $3.7 million, respectively.
107
Wexford provides certain administrative and analytical services to us and, from time to time, we pay for goods and services on behalf of Wexford. For the six months ended June 30, 2016, we incurred approximately $0.1 million in expenses and, as of June 30, 2016, owed approximately $16,000 under these arrangements. For the years ended December 31, 2015 and 2014, we incurred total costs under these arrangements of $0.4 million and $0.1 million, respectively, and, as of December 31, 2015 and 2014, owed approximately $9,000 and $2,000, respectively. To the extent these services will continue after the completion of this offering, we intend to enter into written services agreements on substantially the same terms as those described above.
Pressure Pumping rents equipment from Energy Services, an affiliate of both Wexford and Gulfport. The activity prior to the acquisition of Pressure Pumping is not included in the consolidated financial statements. For the years ended December 31, 2015 and 2014, we incurred total costs under these arrangements of $0.9 million and approximately $42,000, respectively, and, as of December 31, 2015 and 2014, owed approximately $12,000 and $1,000, respectively.
Panther Drilling rents rotary steerable equipment in connection with its directional drilling services from Double Barrel Downhole Technologies, or DBDHT, an affiliate of Wexford. For the six months ended June 30, 2016, we incurred $0.1 million in expenses and, as of June 30, 2016, had no payables outstanding under these arrangements. For the years ended December 31, 2015 and 2014, we incurred total costs under these arrangements of $0.1 million and $0.3 million, respectively, and, as of December 31, 2014, Panther Drilling was owed $0.1 million under these arrangements. We also provide certain management, administrative and treasury functions to DBDHT. As of December 31, 2015, we were owed $4,000 under these arrangements.
Energy Services leases property from Elk City Yard, LLC. During the six months ended June 30, 2016, Energy Services incurred costs of $0.1 million. During the year ended December 31, 2015, Energy Services incurred costs of $0.1 million. There were no amounts owed under this agreement as of either June 30, 2016 or December 31, 2015. The lease extends until 2022 at a rental rate of approximately $0.1 million per year. Elk City Yard LLC is an entity under common control.
On May 7, 2013, Muskie Proppant entered into a transloading agreement with Hopedale Mining LLC, or Hopedale, pursuant to which Hopedale agreed to operate and maintain our Nelms No. 1 rail transloading facility located in Cadiz, Ohio and transload sand on a requirement basis. The agreement provides for a term of two years, subject to the option to terminate as described below. Under the agreement, Muskie Proppant is obligated to pay Hopedale a transloading fee in the amount of $4.00 per ton of sand. If Muskie Proppant fails to transload at least 7,500 tons of sand per month on average for a three-month period or pay an average of $30,000 for each month during such period (or such lesser amount as may be due in accordance with the agreement), Hopedale has the right to terminate the agreement. For the year ended December 31, 2014, Muskie Proppant incurred $0.5 million in costs to Hopedale and, as of December 31, 2014, owed Hopedale $0.1 million, under this agreement. Hopedale is a wholly-owned subsidiary of Rhino, which prior to March 17, 2016 was an affiliate of Wexford.
Dunvegan North Oilfield Services ULC, or Dunvegan, an affiliate of Wexford, provides technical and administrative services and pays for goods and services on our behalf. As of June 30, 2016, we incurred approximately $3,000 in expenses and, as of June 30, 2016, Dunvegan was owed $0.2 million under these arrangements. For the years ended December 31, 2015 and 2014, we incurred total costs under these arrangements of $0.1 million and $0.1 million, respectively, and, as of December 31, 2015 and 2014, owed $0.3 million and $0.4 million, respectively, under these arrangements. We also provide certain management, administrative and treasury functions to Dunvegan. As of December 31, 2015, we were owed approximately $19,000 under these arrangements.
We paid fees to Taylor to transload sand at a rail transloading facility. For the year ended December 31, 2014, we incurred costs of $0.4 million and, as of December 31, 2014, owed $0.1 million for transloading services. We did not incur any costs with this counterparty during the six months ended June 30, 2016 or the year ended December 31, 2015.
108
SG Holdings I, LLC, or SG Holdings, an affiliate of Wexford through May 9, 2014, has historically provided office space and certain technical, administrative and payroll services to us, and we have reimbursed SG Holdings in amounts determined by it based on estimates of the amount of office space provided and the amount of employees’ time spent performing services for us. The reimbursement amounts were determined based upon underlying salary costs of employees performing company-related functions, payroll, revenue or headcount relative to other companies managed by SG Holdings, or specifically identified invoices processed depending on the nature of the cost. As of December 31, 2014, we owed $0.1 million under these arrangements. SG Holdings I no longer provides services to us.
Mammoth leases property from Orange Leaf. During the six months ended June 30, 2016, Mammoth incurred costs of $0.1 million. During the year ended December 31, 2015, Mammoth incurred costs of $0.1 million. There were no amounts owed under this agreement as of either June 30, 2016 or December 31, 2015.
Stingray Energy provides technical and administrative services to and pays for goods and services from Barracuda. As of June 30, 2016, we incurred approximately $4,000 in expenses and, as of June 30, 2016, Barracuda was owed $2,000 under these arrangements. For the years ended December 31, 2015 and 2014, we did not incur costs under these arrangements.
Loans
In July 2013, Muskie Proppant received loans in the aggregate principal amount of approximately $3.5 million from its members, which consisted of Gulfport and entities controlled by Wexford. Muskie Proppant made monthly interest payments on these loans at the prime rate plus 2.5% (5.75% at December 31, 2013). The loans, which were scheduled to mature on July 31, 2015, were repaid in full with borrowings under our revolving credit facility with PNC Bank in November 2014, together with an approximately $0.2 million in interest incurred from January 1, 2014 until such repayment date.
109
PRINCIPAL AND SELLING STOCKHOLDERS
The following table sets forth certain information with respect to the beneficial ownership of our common stock by:
| • | the selling stockholders; |
| • | each stockholder known by us to be the beneficial owner of more than five percent of the outstanding shares of our common stock; |
| • | each of our directors; |
| • | each of our named executive officers; and |
| • | all of our directors and executive officers as a group. |
Except as otherwise indicated, we believe that each of the stockholders named in this table has sole voting and investment power with respect to the shares indicated as beneficially owned.
| Common Stock Beneficially Owned Prior to Offering (1) |
Common Stock Beneficially Owned After Offering (1) |
Common Stock Beneficially Owned After Offering if the Underwriters’ Over- allotment Option Is Exercised in Full (1) |
||||||||||||||||||||||
| Name of Beneficial Owner |
Number | Percentage | Number | Percentage | Number | Percentage | ||||||||||||||||||
| Selling Stockholders and other 5% Stockholders: |
||||||||||||||||||||||||
| Mammoth Energy Holdings LLC(2) |
||||||||||||||||||||||||
| Gulfport Energy Corporation |
||||||||||||||||||||||||
| Rhino Resource Partners LP |
||||||||||||||||||||||||
| Executive Officers and Directors: |
||||||||||||||||||||||||
| Marc McCarthy |
||||||||||||||||||||||||
| Arty Straehla(3) |
||||||||||||||||||||||||
| Mark Layton |
||||||||||||||||||||||||
| Aaron Gaydosik |
||||||||||||||||||||||||
| Arthur Smith |
||||||||||||||||||||||||
| André Weiss |
||||||||||||||||||||||||
| All executive officers and directors as a group ( persons) |
||||||||||||||||||||||||
| * | Director nominee. |
| (1) | Percentage of beneficial ownership is based upon shares of common stock outstanding as of , 2016, and shares of common stock outstanding after the offering. For purposes of this table, a person or group of persons is deemed to have “beneficial ownership” of any shares of common stock which such person has the right to acquire within 60 days. For purposes of computing the percentage of outstanding shares of common stock held by each person or group of persons named above, any security that such person or group of persons has the right to acquire within 60 days is deemed to be outstanding for the purpose of computing the percentage ownership for such person or persons, but is not deemed to be outstanding for the purpose of computing the percentage ownership of any other person. |
110
| (2) | Wexford is the manager of Mammoth Holdings, which is one of the selling stockholders in this offering. The number of shares of common stock to be sold in the offering by Mammoth Holdings includes up to shares of common stock that will be sold if the underwriters exercise their option to purchase additional shares in full. As manager of Mammoth Holdings, Wexford has the exclusive authority to, among other things, purchase, hold and dispose of its assets, including the common stock that will be owned by Mammoth Holdings. Wexford may, by reason of its status as the manager of Mammoth Holdings, be deemed to beneficially own the interest in the shares of common stock owned by Mammoth Holdings. Each of Charles E. Davidson and Joseph M. Jacobs may, by reason of his status as a controlling person of Wexford, be deemed to beneficially own the interests in the shares of common stock owned by Mammoth Holdings. Each of Charles E. Davidson, Joseph M. Jacobs and Wexford share the power to vote and to dispose of shares of common stock owned by Mammoth Holdings. Each of Messrs. Davidson and Jacobs disclaims beneficial ownership of the shares of common stock owned by Mammoth Holdings and Wexford. Wexford’s address is Wexford Plaza, 411 West Putnam Avenue, Greenwich, Connecticut 06830. |
| (3) | On November 24, 2014, in connection with the contributions to Mammoth Partners by Mammoth Holdings, Gulfport and Rhino of their respective interests in our operating subsidiaries, Mr. Straehla was issued 2,767 units in Mammoth Holdings, representing approximately 0.03% of the total units issued, and a 0.5% carried interest in distributions that may be made by Mammoth Holdings that are deemed attributable to Panther Drilling, in exchange for his contribution of the interest he then held in Panther Drilling; provided, however, Mr. Straehla is not entitled to any distributions in respect of this carried interest unless and until each Wexford fund or affiliate has received repayment in full of such Wexford fund’s or affiliate’s capital account with respect to its investment in Panther Drilling. Thereafter, all future distributions made by Mammoth Holdings in respect of Panther Drilling will be paid 99.5% to the Wexford entities and affiliates and 0.5% to Mr. Straehla. Approximately 1.7% of distributions, if and when made by Mammoth Holdings, will be allocated in respect of Panther Drilling. Mr. Straehla is not an officer, manager or director of Mammoth Holdings. |
Each of the selling stockholders in this offering is deemed to be an underwriter within the meaning of Section 2(a)(11) of the Securities Act of 1933, as amended, or the Securities Act.
111
DESCRIPTION OF OUR COMMON STOCK
We will amend and restate our certificate of incorporation and bylaws in connection with this offering. The following description of our common stock, certificate of incorporation and our bylaws are summaries thereof and are qualified by reference to our certificate of incorporation and our bylaws as so amended and restated, copies of which will be filed with the SEC as exhibits to the registration statement of which this prospectus is a part.
Our authorized capital stock consists of 200,000,000 shares of common stock, par value $0.01 per share, and shares of preferred stock, par value $0.01 per share. We have applied for listing of our shares of common stock on The NASDAQ Global Market under the symbol “TUSK.”
Common Stock
Holders of shares of common stock are entitled to one vote per share on all matters submitted to a vote of stockholders. Shares of common stock do not have cumulative voting rights, which means that the holders of more than 50% of the shares voting for the election of the board of directors can elect all the directors to be elected at that time, and, in such event, the holders of the remaining shares will be unable to elect any directors to be elected at that time. Our certificate of incorporation denies stockholders any preemptive rights to acquire or subscribe for any stock, obligation, warrant or other securities of ours. Holders of shares of our common stock have no redemption or conversion rights nor are they entitled to the benefits of any sinking fund provisions.
In the event of our liquidation, dissolution or winding up, holders of shares of common stock shall be entitled to receive, pro rata, all the remaining assets of our company available for distribution to our stockholders after payment of our debts and after there shall have been paid to or set aside for the holders of capital stock ranking senior to common stock in respect of rights upon liquidation, dissolution or winding up the full preferential amounts to which they are respectively entitled.
Holders of record of shares of common stock are entitled to receive dividends when and if declared by the board of directors out of any assets legally available for such dividends, subject to both the rights of all outstanding shares of capital stock ranking senior to the common stock in respect of dividends and to any dividend restrictions contained in debt agreements. All outstanding shares of common stock and any shares sold and issued in this offering will be fully paid and nonassessable by us.
Preferred Stock
Our board of directors is authorized to issue up to 20,000 shares of preferred stock in one or more series and designate:
| • | the distinctive serial designation and number of shares of the series; |
| • | the voting powers and the right, if any, to elect a director or directors; |
| • | the terms of office of any directors the holders of preferred shares are entitled to elect; |
| • | the dividend rights, if any; |
| • | the terms of redemption, and the amount of and provisions regarding any sinking fund for the purchase or redemption thereof; |
| • | the liquidation preferences and the amounts payable on dissolution or liquidation; |
| • | the terms and conditions under which shares of the series may or shall be converted into any other series or class of stock or debt of the corporation; and |
| • | any other terms or provisions which the board of directors is legally authorized to fix or alter. |
112
We do not need stockholder approval to issue or fix the terms of the preferred stock. The actual effect of the authorization of the preferred stock upon your rights as holders of common stock is unknown until our board of directors determines the specific rights of owners of any series of preferred stock. Depending upon the rights granted to any series of preferred stock, your voting power, liquidation preference or other rights could be adversely affected. Preferred stock may be issued in acquisitions or for other corporate purposes. Issuance in connection with a stockholder rights plan or other takeover defense could have the effect of making it more difficult for a third party to acquire, or of discouraging a third party from acquiring, control of our company. We have no present plans to issue any shares of preferred stock.
Related Party Transactions and Corporate Opportunities
Subject to the limitations of applicable law, our certificate of incorporation, among other things:
| • | permits us to enter into transactions with entities in which one or more of our officers or directors are financially or otherwise interested so long as it has been approved by our board of directors; |
| • | permits any of our stockholders, officers or directors to conduct business that competes with us and to make investments in any kind of property in which we may make investments; and |
| • | provides that if any director or officer of one of our affiliates who is also one of our officers or directors becomes aware of a potential business opportunity, transaction or other matter (other than one expressly offered to that director or officer in writing solely in his or her capacity as our director or officer), that director or officer will have no duty to communicate or offer that opportunity to us, and will be permitted to communicate or offer that opportunity to such affiliates and that director or officer will not be deemed to have (i) acted in a manner inconsistent with his or her fiduciary or other duties to us regarding the opportunity or (ii) acted in bad faith or in a manner inconsistent with our best interests. |
Anti-takeover Effects of Provisions of Our Certificate of Incorporation and Our Bylaws
Some provisions of our certificate of incorporation and our bylaws contain provisions that could make it more difficult to acquire us by means of a merger, tender offer, proxy contest or otherwise, or to remove our incumbent officers and directors. These provisions, summarized below, are expected to discourage coercive takeover practices and inadequate takeover bids. These provisions are also designed to encourage persons seeking to acquire control of us to first negotiate with our board of directors. We believe that the benefits of increased protection of our potential ability to negotiate with the proponent of an unfriendly or unsolicited proposal to acquire or restructure us outweigh the disadvantages of discouraging such proposals because negotiation of such proposals could result in an improvement of their terms.
Undesignated preferred stock. The ability to authorize and issue undesignated preferred stock may enable our board of directors to render more difficult or discourage an attempt to change control of us by means of a merger, tender offer, proxy contest or otherwise. For example, if in the due exercise of its fiduciary obligations, the board of directors were to determine that a takeover proposal is not in our best interest, the board of directors could cause shares of preferred stock to be issued without stockholder approval in one or more private offerings or other transactions that might dilute the voting or other rights of the proposed acquirer or insurgent stockholder or stockholder group.
Stockholder meetings. Our certificate of incorporation and bylaws provide that a special meeting of stockholders may be called only by the Chairman of the Board, the Chief Executive Officer or by a resolution adopted by a majority of our board of directors.
113
Requirements for advance notification of stockholder nominations and proposals. Our bylaws establish advance notice procedures with respect to stockholder proposals and the nomination of candidates for election as directors, other than nominations made by or at the direction of the board of directors.
Stockholder action by written consent. Our bylaws provide that, except as may otherwise be provided with respect to the rights of the holders of preferred stock, no action that is required or permitted to be taken by our stockholders at any annual or special meeting may be effected by written consent of stockholders in lieu of a meeting of stockholders, unless the action to be effected by written consent of stockholders and the taking of such action by such written consent have expressly been approved in advance by our board. This provision, which may not be amended except by the affirmative vote of at least 66 2/3% of the voting power of all then outstanding shares of capital stock entitled to vote generally in the election of directors, voting together as a single class, makes it difficult for stockholders to initiate or effect an action by written consent that is opposed by our board.
Amendment of the bylaws. Under Delaware law, the power to adopt, amend or repeal bylaws is conferred upon the stockholders. A corporation may, however, in its certificate of incorporation also confer upon the board of directors the power to adopt, amend or repeal its bylaws. Our certificate of incorporation and bylaws grant our board the power to adopt, amend and repeal our bylaws at any regular or special meeting of the board on the affirmative vote of a majority of the directors then in office. Our stockholders may adopt, amend or repeal our bylaws but only at any regular or special meeting of stockholders by an affirmative vote of holders of at least 66 2/3% of the voting power of all then outstanding shares of capital stock entitled to vote generally in the election of directors, voting together as a single class.
Removal of Director. Our certificate of incorporation and bylaws provide that members of our board of directors may only be removed by the affirmative vote of holders of at least 66 2/3% of the voting power of all then outstanding shares of capital stock entitled to vote generally in the election of directors, voting together as a single class.
Amendment of the Certificate of Incorporation. Our certificate of incorporation provides that, in addition to any other vote that may be required by law or any preferred stock designation, the affirmative vote of the holders of at least 66 2/3% of the voting power of all then outstanding shares of capital stock entitled to vote generally in the election of directors, voting together as a single class, is required to amend, alter or repeal, or adopt any provision as part of our certificate of incorporation inconsistent with the provisions of our certificate of incorporation dealing with distributions on our common stock, related party transactions, our board of directors, our bylaws, meetings of our stockholders or amendment of our certificate of incorporation.
The provisions of our certificate of incorporation and bylaws could have the effect of discouraging others from attempting hostile takeovers and, as a consequence, they may also inhibit temporary fluctuations in the market price of our common stock that often result from actual or rumored hostile takeover attempts. These provisions may also have the effect of preventing changes in our management. It is possible that these provisions could make it more difficult to accomplish transactions which stockholders may otherwise deem to be in their best interests.
Exclusive Forum
Our certificate of incorporation requires, to the fullest extent permitted by law, that derivative actions brought in our name, actions against directors, officers and other employees for breach of a fiduciary duty and other similar actions may be brought only in specified courts in the State of Delaware. Although we believe this provision benefits us by providing increased consistency in the application of Delaware law in the types of lawsuits to which it applies, the provision may have the effect of discouraging lawsuits against our directors, officers and other employees. See “Risk Factors—Our certificate of incorporation designates courts in the State of Delaware as the sole and exclusive forum for certain types of actions and proceedings that may be initiated by our stockholders, which could limit our stockholders’ ability to obtain a favorable judicial forum for disputes with us or our directors, officers or other employees.”
114
Transfer Agent and Registrar
Computershare Trust Company, NA. will be the transfer agent and registrar for our common stock.
Listing
We have applied for listing of shares of our common stock on The NASDAQ Global Market under the symbol “TUSK.”
115
SHARES ELIGIBLE FOR FUTURE SALE
Prior to this offering, there has been no public market for our common stock. Future sales of substantial amounts of our common stock in the public market, or the perception that such sales may occur, could adversely affect the prevailing market price of our common stock. We cannot predict the effect, if any, that future sales of shares, or the availability of shares for future sales, will have on the market price of our common stock prevailing from time to time.
Sale of Restricted Shares
Upon completion of this offering, we will have shares of common stock outstanding. Of these shares of common stock, the shares of common stock being sold in this offering, plus any shares sold upon exercise of the underwriters’ option to purchase additional shares, will be freely tradable without restriction under the Securities Act, except for any such shares held or acquired by an “affiliate” of ours, as that term is defined in Rule 144 promulgated under the Securities Act, which shares will be subject to the volume limitations and other restrictions of Rule 144 described below. The remaining shares of common stock held by our existing stockholders upon completion of this offering, or shares if the underwriters exercise their option to purchase additional shares in full, will be “restricted securities,” as that phrase is defined in Rule 144, and may be resold only after registration under the Securities Act or pursuant to an exemption from such registration, including, among others, the exemptions provided by Rule 144 and 701 under the Securities Act, which rules are summarized below. These remaining shares of common stock held by our existing stockholders upon completion of this offering will be available for sale in the public market after the expiration of the lock-up agreements described in “Underwriting,” taking into account the provisions of Rules 144 and 701 under the Securities Act.
Rule 144
In general, under Rule 144 as currently in effect, persons who became the beneficial owner of shares of our common stock prior to the completion of this offering may sell their shares upon the earlier of (1) the expiration of a six-month holding period, if we have been subject to the reporting requirements of the Securities Exchange Act of 1934, as amended, or the Exchange Act, for at least 90 days prior to the date of the sale and have filed all reports required thereunder, or (2) the expiration of a one-year holding period.
At the expiration of the six-month holding period, assuming we have been subject to the Exchange Act reporting requirements for at least 90 days and have filed all reports required thereunder, a person who was not one of our affiliates at any time during the three months preceding a sale would be entitled to sell an unlimited number of shares of our common stock, and a person who was one of our affiliates at any time during the three months preceding a sale would be entitled to sell, within any three-month period, a number of shares of common stock that does not exceed the greater of either of the following:
| • | 1% of the number of shares of our common stock then outstanding, which will equal approximately shares immediately after this offering; or |
| • | the average weekly trading volume of our common stock on The NASDAQ Global Market during the four calendar weeks preceding the filing of a notice on Form 144 with respect to the sale. |
At the expiration of the one-year holding period, a person who was not one of our affiliates at any time during the three months preceding a sale would be entitled to sell an unlimited number of shares of our common stock without restriction. A person who was one of our affiliates at any time during the three months preceding a sale would remain subject to the volume restrictions described above.
Sales under Rule 144 by our affiliates are also subject to manner of sale provisions and notice requirements and to the availability of current public information about us.
116
Rule 701
In general, under Rule 701, any of our employees, directors, officers, consultants or advisors who purchased shares from us in connection with a compensatory stock or option plan or other written agreement before the effective date of this offering, or who purchased shares from us after that date upon the exercise of options granted before that date, are eligible to resell such shares in reliance upon Rule 144 beginning 90 days after the date of this prospectus. If such person is not an affiliate, the sale may be made subject only to the manner-of-sale restrictions of Rule 144. If such a person is an affiliate, the sale may be made under Rule 144 without compliance with its one-year minimum holding period, but subject to the other Rule 144 restrictions.
Registration Rights
We will enter into a registration right agreement with Mammoth Holdings prior to the closing of this offering, under which Mammoth Holdings and its affiliates (including Wexford) will have the right to cause us to register under the Securities Act and applicable state securities laws the offer and sale of any of our common stock that they hold, subject to the 180-day lock up agreement they have entered into in connection with this offering and certain other exceptions. In addition, under the investor rights agreement that we will to enter into prior to the closing of this offering, Gulfport will have similar registration rights with respect to the common stock that it holds. Our registration rights agreement with Rhino will provide for piggyback registration rights.
Subject to the terms and conditions of the applicable agreements, these registration rights allow the beneficiaries or their assignees holding any shares of our common stock to require registration of any of these shares and/or to include any of these shares in a registration by us of other shares of common stock, including shares of common stock offered by us or by any stockholder. In connection with any registration of this kind, we will indemnify each stockholder participating in the registration and its officers, directors, and controlling persons from and against any liabilities under the Securities Act or any applicable state securities laws arising from the registration statement or prospectus. We will bear all costs and expenses incidental to any registration, excluding any underwriting discount. Except as otherwise described herein and under the heading “—Lock-up Agreements,” Mammoth Holdings and its affiliates (including Wexford), Gulfport and Rhino may sell their shares of common stock in private transactions at any time, subject to compliance with applicable laws.
Stock Plans
We intend to file one or more registration statements on Form S-8 under the Securities Act to register shares of our common stock issued or reserved for issuance under our equity incentive plan. The first such registration statement is expected to be filed soon after the date of this prospectus and will automatically become effective upon filing with the SEC. Accordingly, shares registered under such registration statement will be available for sale in the open market following the effective date, unless such shares are subject to vesting restrictions with us, Rule 144 restrictions applicable to our affiliates or the lock-up restrictions described below.
Lock-Up Agreements
We, each of our directors and executive officers, Mammoth Holdings, Gulfport and Rhino have agreed that, without the prior written consent of the representative of the several underwriters in this offering, we and they will not, directly or indirectly, for a period of 180 days after the date of the offering, offer, pledge, sell, contract to sell or otherwise transfer or dispose of any shares of our common stock (other than the shares of our common stock subject to this offering) or any other securities convertible into or exercisable or exchangeable for our common stock (subject to certain exceptions). For additional information, see “Underwriting.”
117
MATERIAL U.S. FEDERAL INCOME TAX CONSEQUENCES
FOR NON-U.S. HOLDERS
The following is a general discussion of material U.S. federal income and estate tax consequences of the ownership and disposition of our common stock by a non-U.S. holder. This discussion deals only with common stock purchased in this offering that is held as a capital asset by a non-U.S. holder. Except as modified for estate tax purposes, the term “non-U.S. holder” means a beneficial owner of our common stock that is not, for U.S. federal income and estate tax purposes:
| • | an individual who is a citizen or resident of the United States; |
| • | a corporation (including any entity treated as a corporation for U.S. federal income tax purposes) created or organized in or under the laws of the United States, any state thereof or the District of Columbia; |
| • | an estate whose income is subject to U.S. federal income taxation regardless of its source; or |
| • | a trust, if a court within the United States is able to exercise primary supervision over the administration of the trust and one or more United States persons (as defined under the Code) have authority to control all substantial decisions of the trust, or if it has a valid election in effect under applicable U.S. Treasury Regulations to be treated as a United States person. |
An individual may generally be treated as a resident of the United States in any calendar year for U.S. federal income tax purposes, by, among other ways, being present in the United States for at least 31 days in that calendar year and for an aggregate of at least 183 days during a three-year period ending in the current calendar year. For purposes of the 183-day calculation, all of the days present in the current year, one-third of the days present in the immediately preceding year and one-sixth of the days present in the second preceding year are counted. Residents are taxed for U.S. federal income tax purposes as if they were U.S. citizens.
This discussion is based upon provisions of the Code, the U.S. Treasury Regulations promulgated thereunder, administrative rulings and judicial decisions, all as of the date hereof. Those authorities may be changed, even retroactively, so as to result in U.S. federal income and estate tax consequences different from those discussed herein. This discussion does not address all aspects of U.S. federal income and estate taxation and does not deal with other U.S. federal tax laws (such as gift tax laws) or foreign, state, local or other tax considerations that may be relevant to non-U.S. holders in light of their personal circumstances. In addition, this discussion does not address tax considerations applicable to investors that may be subject to special treatment under the U.S. federal income tax laws, such as (without limitation):
| • | certain former U.S. citizens or residents; |
| • | stockholders that hold our common stock as part of a straddle, constructive sale transaction, synthetic security, hedge, conversion transaction or other integrated investment or risk reduction transaction; |
| • | stockholders that acquired our common stock through the exercise of employee stock options or otherwise as compensation or through a tax-qualified retirement plan; |
| • | stockholders that are partnerships or entities treated as partnerships for U.S. federal income tax purposes or other pass-through entities or owners thereof; |
| • | “Controlled Foreign Corporations;” |
| • | “Passive Foreign Investment Companies;” |
118
| • | financial institutions; |
| • | insurance companies; |
| • | tax-exempt entities; |
| • | dealers in securities or foreign currencies; and |
| • | traders in securities that use a mark-to-market method of accounting for U.S. federal income tax purposes. |
If a partnership (including an entity treated as a partnership for U.S. federal income tax purposes) holds our common stock, the tax treatment of a partner generally will depend upon the status of the partner and the activities of the partnership. If you are a partner of a partnership (including an entity treated as a partnership for U.S. federal income tax purposes) holding our common stock, you should consult your tax advisor.
Investors considering the purchase of our common stock should consult their own tax advisors regarding the application of the U.S. federal income and estate and gift tax laws to their particular situation as well as the applicability and effect of any state, local or foreign tax laws or tax treaties.
Distributions on Common Stock
We do not expect to pay any cash distributions on our common stock in the foreseeable future. However, in the event we do make such cash distributions, these distributions generally will constitute dividends for U.S. federal income tax purposes to the extent paid from our current or accumulated earnings and profits, as determined under U.S. federal income tax principles. If any such distribution exceeds our current and accumulated earnings and profits, the excess will be treated as a non-taxable return of capital to the extent of the non-U.S. holder’s tax basis in our common stock and thereafter as capital gain from the sale or exchange of such common stock. See “—Gain on Disposition of Common Stock.” Dividends paid to a non-U.S. holder of our common stock that are not effectively connected with the non-U.S. holder’s conduct of a trade or business within the United States will be subject to U.S. withholding tax at a 30% rate, or if an income tax treaty applies, a lower rate specified by the treaty. In order to receive a reduced treaty rate, a non-U.S. holder must provide to the withholding agent Internal Revenue Service, or IRS, Form W-8BEN or W-8BEN-E, as applicable (or applicable substitute or successor form), properly certifying eligibility for the reduced rate.
Dividends that are effectively connected with a non-U.S. holder’s conduct of a trade or business in the United States and, if an income tax treaty so requires, are attributable to a permanent establishment maintained by the non-U.S. holder in the United States, are taxed on a net income basis at the regular graduated rates and in the manner applicable to United States persons (as defined under the Code). In that case, we will not have to withhold U.S. federal withholding tax if the non-U.S. holder complies with applicable certification and disclosure requirements (which may generally be met by providing an IRS Form W-8ECI). In addition, a “branch profits tax” may be imposed at a 30% rate (or a lower rate specified under an applicable income tax treaty) on dividends received by a foreign corporation that are effectively connected with its conduct of a trade or business in the United States.
Gain on Disposition of Common Stock
A non-U.S. holder generally will not be subject to U.S. federal income tax on gain recognized on a disposition of our common stock unless:
| • | the gain is effectively connected with the non-U.S. holder’s conduct of a trade or business in the United States and, if an income tax treaty applies and so requires, is attributable to a permanent establishment maintained by the non-U.S. holder in the United States, in which case, the gain will be |
119
| taxed on a net income basis at the rates and in the manner applicable to United States persons (as defined under the Code), and if the non-U.S. holder is a foreign corporation, the branch profits tax described above may also apply; |
| • | the non-U.S. holder is an individual who is present in the United States for 183 days or more in the taxable year of the disposition and meets other requirements, in which case, the non-U.S. holder will be subject to a flat 30% tax on the gain derived from the disposition, which may be offset by U.S. source capital losses; or |
| • | we are or have been a “United States real property holding corporation,” or USRPHC, for U.S. federal income tax purposes at any time during the shorter of the five-year period ending on the date of disposition or the period that the non-U.S. holder held our common stock. |
Generally, a corporation is a USRPHC if the fair market value of its United States real property interests equals or exceeds 50% of the sum of the fair market value of its worldwide real property interests and its other assets used or held for use in a trade or business. We have not determined whether we are currently a USRPHC for United States federal income tax purposes, but we do not believe we are a USRPHC and we do not anticipate becoming one in the future. If we are or become a USRPHC, a non-U.S holder nonetheless will not be subject to U.S. federal income tax or withholding in respect of any gain realized on a sale or other disposition of our common stock so long as (i) our common stock is “regularly traded on an established securities market” for U.S. federal income tax purposes and (ii) such non-U.S. holder does not actually or constructively own, at any time during the applicable period described in the third bullet point, above, more than 5% of our outstanding common stock.
Information Reporting and Backup Withholding Tax
Dividends paid to you will generally be subject to information reporting and may be subject to U.S. backup withholding. You will be exempt from backup withholding if you properly provide an IRS Form W-8BEN or W-8BEN-E or W-8ECI certifying under penalties of perjury that you are a non-U.S. holder or otherwise meet documentary evidence requirements for establishing that you are a non-U.S. holder, or you otherwise establish an exemption. Copies of the information returns reporting such dividends and the tax withheld with respect to such dividends also may be made available to the tax authorities in the country in which you reside.
The gross proceeds from the disposition of our common stock may be subject to information reporting and backup withholding. If you receive payments of the proceeds of a disposition of our common stock to or through a U.S. office of a broker, the payment will be subject to both U.S. backup withholding and information reporting unless you properly provide an IRS Form W-8BEN or W-8BEN-E or W-8ECI certifying under penalties of perjury that you are a non-U.S. person (and the payor does not have actual knowledge or reason to know that you are a United States person, as defined under the Code) or you otherwise establish an exemption. If you sell your common stock outside the United States through a non-U.S. office of a non-U.S. broker and the sales proceeds are paid to you outside the United States, then the U.S. backup withholding and information reporting requirements generally will not apply to that payment. However, U.S. information reporting, but not backup withholding, will generally apply to a payment of sales proceeds, even if that payment is made outside the United States, if you sell your common stock through a non-U.S. office of a broker that has certain relationships with the United States unless the broker has documentary evidence in its files that you are a non-U.S. person and certain other conditions are met, or you otherwise establish an exemption.
Backup withholding is not an additional tax. You may obtain a refund or credit of any amounts withheld under the backup withholding rules that exceed your U.S. federal income tax liability, if any, provided the required information is timely furnished to the IRS.
120
Federal Estate Tax
Our common stock that is owned (or treated as owned) by an individual who is not a citizen or resident of the United States (as specially defined for United States federal estate tax purposes) at the time of death will be included in such individual’s gross estate for United States federal estate tax purposes, unless an applicable tax treaty provides otherwise, and, therefore, may be subject to United States federal estate tax.
Foreign Account Tax Compliance Act
Under the Foreign Account Tax Compliance Act, or FATCA, a 30% withholding tax will generally apply to dividends on, or gross proceeds from the sale or other disposition of, common stock paid to a foreign financial institution unless the foreign financial institution (i) enters into an agreement with the U.S. Treasury to, among other things, undertake to identify accounts held by certain U.S. persons or U.S.-owned foreign entities, annually report certain information about such accounts, and withhold 30% on payments to account holders whose actions prevent it from complying with these reporting and other requirements, (ii) is resident in a country that has entered into an intergovernmental agreement with the United States in relation to such withholding and information reporting and the financial entity complies with related information reporting requirements of such country, or (iii) qualifies for an exemption from these rules. A foreign financial institution generally is a foreign entity that (i) accepts deposits in the ordinary course of a banking or similar business, (ii) as a substantial portion of its business, holds financial assets for the benefit of one or more other persons, or (iii) is an investment entity that, in general, primarily conducts as a business on behalf of customers trading in certain financial instruments, individual or collective portfolio management or otherwise investing, administering, or managing funds, money or certain financial assets on behalf of other persons. In addition, FATCA generally imposes a 30% withholding tax on the same types of payments to a non-financial foreign entity unless the entity certifies that it does not have any substantial U.S. owners, furnishes identifying information regarding each substantial U.S. owner, or otherwise qualifies for an exemption from these rules. In either case, such payments would include U.S.-source dividends and the gross proceeds from the sale or other disposition of stock that can produce U.S.-source dividends. FATCA’s withholding obligations generally will apply to payments of dividends on our common stock, and to payments of gross proceeds from the sale or other disposition of our common stock made on or after January 1, 2019.
The final Treasury regulations and subsequent guidance provide detailed guidance regarding the reporting, withholding and other obligations under FATCA. Investors should consult their tax advisors regarding the possible impact of the FATCA rules on their investment in our common stock, including, without limitation, the process and deadlines for meeting the applicable requirements to prevent the imposition of the 30% withholding tax under FATCA.
THE SUMMARY OF MATERIAL U.S. FEDERAL INCOME AND ESTATE TAX CONSIDERATIONS ABOVE IS INCLUDED FOR GENERAL INFORMATION PURPOSES ONLY. POTENTIAL PURCHASERS OF OUR COMMON STOCK ARE URGED TO CONSULT THEIR OWN TAX ADVISORS TO DETERMINE THE U.S. FEDERAL, STATE, LOCAL AND NON-U.S. TAX CONSIDERATIONS OF PURCHASING, OWNING AND DISPOSING OF OUR COMMON STOCK.
121
Under the terms and subject to the conditions contained in an underwriting agreement with respect to the common stock being offered, we and the selling stockholders have agreed to sell to the underwriters named below, for whom Credit Suisse Securities (USA) LLC is acting as representative, the following respective numbers of common stock:
| Underwriter |
Number of Shares of Common Stock |
|||
| Credit Suisse Securities (USA) LLC |
||||
|
|
|
|||
| Total |
||||
|
|
|
|||
The underwriting agreement provides that the underwriters are obligated to purchase all of the shares of common stock in the offering if any are purchased, other than those shares of common stock covered by the option to purchase additional shares described below. The underwriting agreement also provides that if an underwriter defaults, the purchase commitments of non-defaulting underwriters may be increased or the offering may be terminated. Each of the selling stockholders in this offering is deemed to be an underwriter within the meaning of Section 2(a)(11) of the Securities Act.
We and the selling stockholders have granted to the underwriters a 30-day option to purchase up to an aggregate of additional shares of common stock at the initial public offering price less the underwriting discounts and commissions. To the extent that the underwriters exercise their option to purchase additional shares, each underwriter will purchase such additional shares of common stock from us and the selling stockholders in approximately the same proportion as they purchased the shares of common stock shown in the table above.
The underwriters propose to offer the common stock initially at the public offering price on the cover page of this prospectus and to selling group members at that price less a selling concession of $ per share of common stock. The underwriters and selling group members may allow a discount of $ per share of common stock on sales to other broker/dealers. After the initial public offering the representatives may change the public offering price and concession and discount to broker/dealers. The offering of the common stock by the underwriters is subject to receipt and acceptance and subject to the underwriters’ right to reject any order in whole or in part.
The following table summarizes the compensation and estimated expenses we will pay:
| Per Share | Total | |||||||||||||||
| Without Over- allotment |
With Over- allotment |
Without Over- allotment |
With Over- allotment |
|||||||||||||
| Public offering price for common stock sold by us |
$ | $ | $ | $ | ||||||||||||
| Underwriting Discounts and Commissions paid by us |
$ | $ | $ | $ | ||||||||||||
| Estimated expenses payable by us |
$ | $ | $ | $ | ||||||||||||
| Public offering price for common stock sold by the selling stockholders |
$ | $ | $ | $ | ||||||||||||
| Underwriting Discounts and Commissions paid by the selling stockholders |
$ | $ | $ | $ | ||||||||||||
| Estimated expenses payable by the selling stockholders |
$ | $ | $ | $ | ||||||||||||
We estimate that our out-of-pocket expenses for this offering, excluding underwriting discounts and commissions, will be approximately $ million. We have also agreed to reimburse the underwriters for certain of their expenses in an amount up to $ . The selling stockholders will not bear any portion of these expenses.
The representative has informed us that it does not expect sales to accounts over which the underwriters have discretionary authority to exceed 5% of the common stock being offered.
122
We have agreed that, subject to certain exceptions, we will not offer, sell, contract to sell, pledge or otherwise dispose of, directly or indirectly, or file with the SEC a registration statement under the Securities Act relating to any of our common stock or securities convertible into or exchangeable or exercisable for any of our common stock, or publicly disclose the intention to make any offer, sale, pledge, disposition or filing, without the prior written consent of the representative of the underwriters for a period of 180 days after the date of this prospectus.
Mammoth Holdings, Gulfport and Rhino, which are the selling stockholders in this offering, as well as our executive officers and directors, have each agreed that, subject to certain exceptions, they will not offer, sell, contract to sell, pledge or otherwise dispose of, directly or indirectly, any shares of our common stock or securities convertible into or exchangeable or exercisable for any shares of our common stock, enter into a transaction that would have the same effect, or enter into any swap, hedge or other arrangement that transfers, in whole or in part, any of the economic consequences of ownership of our common stock, whether any of these transactions are to be settled by delivery of our common stock or other securities, in cash or otherwise, or publicly disclose the intention to make any offer, sale, pledge or disposition, or to enter into any transaction, swap, hedge or other arrangement, without, in each case, the prior written consent of the representative of the underwriters in this offering for a period of 180 days after the date of this prospectus. The representative of the underwriters in this offering, in its sole discretion, may release the common stock and other securities subject to the lock-up agreements described above in whole or in part at any time. When determining whether or not to release the common stock and other securities from lock-up agreements, the representative will consider, among other factors, the holder’s reasons for requesting the release and the number of shares of common stock or other securities for which the release is being requested.
The underwriters have reserved for sale at the initial public offering price up to % of the common stock being offered by this prospectus for sale to our employees, executive officers, directors, business associates and related persons who have expressed an interest in purchasing shares of common stock in the offering. The number of shares of common stock available for sale to the general public in the offering will be reduced to the extent these persons purchase the reserved common stock. Any reserved shares of common stock not so purchased will be offered by the underwriters to the general public on the same terms as the other shares of common stock. Any shares of common stock sold in the directed stock program to directors and executive officers will be subject to the 180-day lock-up agreements described above.
We have agreed to indemnify the underwriters against liabilities under the Securities Act, or contribute to payments that the underwriters may be required to make in that respect.
We have applied for listing of our common stock on The NASDAQ Global Market under the symbol “TUSK.”
In connection with the listing of our common stock on The NASDAQ Global Market, the underwriters will undertake to sell round lots of 100 shares of common stock or more to a minimum of 400 beneficial owners.
Prior to this offering, there has been no public market for our common stock. The initial public offering price for our common stock will be determined by negotiation between us and the underwriters. The principal factors to be considered in determining the initial public offering price include the following:
| • | the general condition of the securities markets; |
| • | market conditions for initial public offerings; |
| • | the market for securities of companies in businesses similar to ours; |
| • | the history and prospects for the industry in which we compete; |
| • | our past and present operations and earnings and our current financial position; |
123
| • | the history and prospects for our business; |
| • | an assessment of our management; and |
| • | other information included in this prospectus and otherwise available to the underwriters. |
We cannot assure you that the initial public offering price will correspond to the price at which our common stock will trade in the public market subsequent to this offering or that an active trading market will develop and continue after this offering.
The underwriters and their respective affiliates are full service financial institutions engaged in various activities, which may include securities trading, commercial and investment banking, financial advisory, investment management, investment research, principal investment hedging, financing and brokerage activities. Certain of the underwriters and their respective affiliates have from time to time performed, and may in the future perform, various financial advisory, commercial banking and investment banking services for us and for our affiliates in the ordinary course of business for which they have received and would receive customary compensation.
In the ordinary course of their various business activities, the underwriters and their respective affiliates may make or hold a broad array of investments and actively trade debt and equity securities (or related derivative securities) and financial instruments (including bank loans) for their own account and for the accounts of their customers, and such investments and securities activities may involve securities and/or instruments of the issuer. The underwriters and their respective affiliates may also make investment recommendations and/or publish or express independent research views in respect of such securities or instruments and may at any time hold, or recommend to clients that they acquire, long and/or short positions in such securities and instruments.
In connection with the offering the underwriters may engage in stabilizing transactions, over-allotment transactions, syndicate covering transactions and penalty bids in accordance with Regulation M under the Exchange Act.
| • | Stabilizing transactions permit bids to purchase the underlying security so long as the stabilizing bids do not exceed a specified maximum. |
| • | Over-allotment involves sales by the underwriters of common stock in excess of the number of shares of our common stock the underwriters are obligated to purchase, which creates a syndicate short position. The short position may be either a covered short position or a naked short position. In a covered short position, the number of shares over-allotted by the underwriters is not greater than the number of shares that they may purchase in the over-allotment option. In a naked short position, the number of shares of common stock involved is greater than the number of shares in the over-allotment option. The underwriters may close out any covered short position by either exercising their over-allotment option and/or purchasing common stock in the open market. |
| • | Syndicate covering transactions involve purchases of the common stock in the open market after the distribution has been completed in order to cover syndicate short positions. In determining the source of common stock to close out the short position, the underwriters will consider, among other things, the price of common stock available for purchase in the open market as compared to the price at which they may purchase common stock through the over-allotment option. If the underwriters sell more common stock than could be covered by the over-allotment option, a naked short position, the position can only be closed out by buying common stock in the open market. A naked short position is more likely to be created if the underwriters are concerned that there could be downward pressure on the price of the common stock in the open market after pricing that could adversely affect investors who purchase in the offering. |
124
| • | Penalty bids permit the representative to reclaim a selling concession from a syndicate member when the common stock originally sold by the syndicate member is purchased in a stabilizing or syndicate covering transaction to cover syndicate short positions. |
These stabilizing transactions, syndicate covering transactions and penalty bids may have the effect of raising or maintaining the market price of our common stock or preventing or retarding a decline in the market price of our common stock. As a result, the price of our common stock may be higher than the price that might otherwise exist in the open market. These transactions may be effected on The NASDAQ Global Market or otherwise and, if commenced, may be discontinued at any time.
A prospectus in electronic format may be made available on the web sites maintained by one or more of the underwriters, or selling group members, if any, participating in this offering and one or more of the underwriters participating in this offering may distribute prospectuses electronically. The representative may agree to allocate a number of shares of common stock to underwriters and selling group members for sale to their online brokerage account holders. Internet distributions will be allocated by the underwriters and selling group members that will make internet distributions on the same basis as other allocations.
European Economic Area
In relation to each Member State of the European Economic Area which has implemented the Prospectus Directive (each such state being referred to herein as a Relevant Member State), each underwriter has represented and agreed that with effect from and including the date on which the Prospectus Directive is implemented in that Relevant Member State (each such date being referred to herein as a Relevant Implementation Date) it has not made and will not make an offer of common stock to the public in that Relevant Member State prior to the publication of a prospectus in relation to the common stock which has been approved by the competent authority in that Relevant Member State or, where appropriate, approved in another Relevant Member State and notified to the competent authority in that Relevant Member State, all in accordance with the Prospectus Directive, except that it may, with effect from and including the Relevant Implementation Date, make an offer of common stock to the public in that Relevant Member State at any time:
(a) to legal entities which are authorized or regulated to operate in the financial markets or, if not so authorized or regulated, whose corporate purpose is solely to invest in securities;
(b) to any legal entity which has two or more of (1) an average of at least 250 employees during the last financial year, (2) a total balance sheet of more than €43,000,000 and (3) an annual net turnover of more than €50,000,000, as shown in its last annual or consolidated accounts;
(c) to fewer than 100 natural or legal persons (other than qualified investors as defined in the Prospectus Directive) subject to obtaining the prior consent of the representatives for any such offer; or
(d) in any other circumstances that do not require the publication by us of a prospectus pursuant to Article 3 of the Prospectus Directive.
For the purposes of this provision, the expression an “offer of common stock to the public” in relation to any common stock in any Relevant Member State means the communication in any form and by any means of sufficient information on the terms of the offer and the common stock to be offered so as to enable an investor to decide to purchase or subscribe the common stock, as the same may be varied in that Relevant Member State by any measure implementing the Prospectus Directive in that Relevant Member State and the expression Prospectus Directive means Directive 2003/71/EC and includes any relevant implementing measure in each Relevant Member State.
125
United Kingdom
Each underwriter has represented and agreed that:
(a) it has only communicated or caused to be communicated and will only communicate or cause to be communicated an invitation or inducement to engage in investment activity (within the meaning of Section 21 of the Financial Services and Markets Act 2000, or the FSMA) received by it in connection with the issue or sale of the common stock in circumstances in which Section 21(1) of the FSMA does not apply to us; and
(b) it has complied and will comply with all applicable provisions of the FSMA with respect to anything done by it in relation to the common stock in, from or otherwise involving the United Kingdom.
Hong Kong
The common stock may not be offered or sold by means of any document other than (i) in circumstances which do not constitute an offer to the public within the meaning of the Companies Ordinance (Cap.32, Laws of Hong Kong), or (ii) to “professional investors” within the meaning of the Securities and Futures Ordinance (Cap.571, Laws of Hong Kong) and any rules made thereunder or (iii) in other circumstances that do not result in the document being a “prospectus” within the meaning of the Companies Ordinance (Cap.32, Laws of Hong Kong), and no advertisement, invitation or document relating to the common stock may be issued or may be in the possession of any person for the purpose of issue (in each case whether in Hong Kong or elsewhere), which is directed at, or the contents of which are likely to be accessed or read by, the public in Hong Kong (except if permitted to do so under the laws of Hong Kong) other than with respect to common stock which are or are intended to be disposed of only to persons outside Hong Kong or only to “professional investors” within the meaning of the Securities and Futures Ordinance (Cap.571, Laws of Hong Kong) and any rules made thereunder.
Singapore
This prospectus has not been registered as a prospectus with the Monetary Authority of Singapore. Accordingly, this prospectus and any other document or material in connection with the offer or sale, or invitation for subscription or purchase, of the common stock may not be circulated or distributed, nor may the common stock be offered or sold, or be made the subject of an invitation for subscription or purchase, whether directly or indirectly, to persons in Singapore other than (i) to an institutional investor under Section 274 of the Securities and Futures Act, Chapter 289 of Singapore, or the SFA, (ii) to a relevant person, or any person pursuant to Section 275(1A), and in accordance with the conditions, specified in Section 275 of the SFA or (iii) otherwise pursuant to, and in accordance with the conditions of, any other applicable provision of the SFA.
Where the common stock are subscribed or purchased under Section 275 by a relevant person which is: (a) a corporation (which is not an accredited investor) the sole business of which is to hold investments and the entire share capital of which is owned by one or more individuals, each of whom is an accredited investor; or (b) a trust (where the trustee is not an accredited investor) whose sole purpose is to hold investments and each beneficiary is an accredited investor, shares, debentures and units of shares and debentures of that corporation or the beneficiaries’ rights and interest in that trust shall not be transferable for 6 months after that corporation or that trust has acquired the common stock under Section 275 except: (1) to an institutional investor under Section 274 of the SFA or to a relevant person, or any person pursuant to Section 275(1A), and in accordance with the conditions, specified in Section 275 of the SFA; (2) where no consideration is given for the transfer; or (3) by operation of law.
Japan
The securities have not been and will not be registered under the Financial Instruments and Exchange Law of Japan, or the Financial Instruments and Exchange Law, and each underwriter has agreed that it will not offer or sell any securities, directly or indirectly, in Japan or to, or for the benefit of, any resident of Japan (which term
126
as used herein means any person resident in Japan, including any corporation or other entity organized under the laws of Japan), or to others for re-offering or resale, directly or indirectly, in Japan or to a resident of Japan, except pursuant to an exemption from the registration requirements of, and otherwise in compliance with, the Financial Instruments and Exchange Law and any other applicable laws, regulations and ministerial guidelines of Japan.
127
The validity of the common stock that are offered hereby by us and the selling stockholders will be passed upon by Akin Gump Strauss Hauer & Feld LLP. Certain legal matters will be passed upon for the underwriters by Latham & Watkins LLP, Houston, Texas.
The audited consolidated financial statements of Mammoth Energy Partners LP as of December 31, 2015 and 2014 and for the years then ended included in this prospectus and elsewhere in the registration statement have been so included in reliance upon the report of Grant Thornton LLP, independent registered public accountants, upon the authority of said firm as experts in accounting and auditing.
The audited combined financial statements of Stingray Pressure Pumping LLC and Affiliate as of December 31, 2013 and 2012 and for the year ended December 31, 2013 and the period from the March 20, 2012 (inception) to December 31, 2012 included in this prospectus and elsewhere in the registration statement have been so included in reliance upon the report of Grant Thornton LLP, independent certified public accountants, upon the authority of said firm as experts in accounting and auditing.
The statements of revenues and direct operating expenses of certain drilling rigs of Lantern Drilling Company acquired by Bison Drilling and Field Services LLC for the years ended December 31, 2013 and 2012 included in this prospectus and elsewhere in the registration statement have been so included in reliance upon the report of Grant Thornton LLP, independent certified public accountants, upon the authority of said firm as experts in accounting and auditing.
The balance sheet of Mammoth Energy Services, Inc. as of June 30, 2016 included in this prospectus and elsewhere in the registration statement has been so included in reliance upon the report of Grant Thornton LLP, independent registered public accountants, upon the authority of said firm as experts in accounting and auditing.
WHERE YOU CAN FIND MORE INFORMATION
We have filed with the SEC a registration statement on Form S-1 under the Securities Act covering the securities offered by this prospectus. This prospectus, which constitutes a part of that registration statement, does not contain all of the information that you can find in that registration statement and its exhibits. Certain items are omitted from this prospectus in accordance with the rules and regulations of the SEC. For further information about us and the common stock offered by this prospectus, reference is made to the registration statement and the exhibits filed with the registration statement. Statements contained in this prospectus as to the contents of any contract or other document referred to are not necessarily complete and in each instance such statement is qualified by reference to each such contract or document filed as part of the registration statement. When we complete this offering, we will be required to file annual, quarterly and current reports, proxy statements and other information with the SEC. You may read any materials we file with the SEC free of charge at the SEC’s Public Reference Room at 100 F Street, N.E., Washington, D.C. 20549. Copies of all or any part of these documents may be obtained from such office upon the payment of the fees prescribed by the SEC. The public may obtain information on the operation of the public reference room by calling the SEC at 1-800-SEC-0330. The SEC maintains an Internet site that contains reports, proxy and information statements and other information regarding registrants that file electronically with the SEC. The address of the site is www.sec.gov. The registration statement, including all exhibits thereto and amendments thereof, has been filed electronically with the SEC.
128
Appendix A
GLOSSARY OF OIL AND NATURAL GAS TERMS
Blowout. An uncontrolled flow of reservoir fluids into the wellbore, and sometimes catastrophically to the surface. A blowout may consist of salt water, oil, natural gas or a mixture of these. Blowouts can occur in all types of exploration and production operations, not just during drilling operations. If reservoir fluids flow into another formation and do not flow to the surface, the result is called an underground blowout. If the well experiencing a blowout has significant open-hole intervals, it is possible that the well will bridge over (or seal itself with rock fragments from collapsing formations) down-hole and intervention efforts will be averted.
Bottomhole assembly. The lower portion of the drillstring, consisting of (from the bottom up in a vertical well) the bit, bit sub, a mud motor (in certain cases), stabilizers, drill collar, heavy-weight drillpipe, jarring devices (“jars”) and crossovers for various threadforms. The bottomhole assembly must provide force for the bit to break the rock (weight on bit), survive a hostile mechanical environment and provide the driller with directional control of the well. Oftentimes the assembly includes a mud motor, directional drilling and measuring equipment, measurements-while-drilling tools, logging-while-drilling tools and other specialized devices.
Cementing. To prepare and pump cement into place in a wellbore.
Coiled tubing. A long, continuous length of pipe wound on a spool. The pipe is straightened prior to pushing into a wellbore and rewound to coil the pipe back onto the transport and storage spool. Depending on the pipe diameter (1 in. to 4 1/2 in.) and the spool size, coiled tubing can range from 2,000 ft. to 15,000 ft. (610 m to 4,570 m) or greater length.
Completion. A generic term used to describe the assembly of down-hole tubulars and equipment required to enable safe and efficient production from an oil or gas well. The point at which the completion process begins may depend on the type and design of the well.
Directional drilling. The intentional deviation of a wellbore from the path it would naturally take. This is accomplished through the use of whipstocks, bottomhole assembly (BHA) configurations, instruments to measure the path of the wellbore in three-dimensional space, data links to communicate measurements taken down-hole to the surface, mud motors and special BHA components and drill bits, including rotary steerable systems, and drill bits. The directional driller also exploits drilling parameters such as weight on bit and rotary speed to deflect the bit away from the axis of the existing wellbore. In some cases, such as drilling steeply dipping formations or unpredictable deviation in conventional drilling operations, directional-drilling techniques may be employed to ensure that the hole is drilled vertically. While many techniques can accomplish this, the general concept is simple: point the bit in the direction that one wants to drill. The most common way is through the use of a bend near the bit in a down-hole steerable mud motor. The bend points the bit in a direction different from the axis of the wellbore when the entire drillstring is not rotating. By pumping mud through the mud motor, the bit turns while the drillstring does not rotate, allowing the bit to drill in the direction it points. When a particular wellbore direction is achieved, that direction may be maintained by rotating the entire drillstring (including the bent section) so that the bit does not drill in a single direction off the wellbore axis, but instead sweeps around and its net direction coincides with the existing wellbore. Rotary steerable tools allow steering while rotating, usually with higher rates of penetration and ultimately smoother boreholes.
Down-hole. Pertaining to or in the wellbore (as opposed to being on the surface).
Down-hole motor. A drilling motor located in the drill string above the drilling bit powered by the flow of drilling mud. Down-hole motors are used to increase the speed and efficiency of the drill bit or can be used to steer the bit in directional drilling operations. Drilling motors have become very popular because of horizontal and directional drilling applications and the increase of day rates for drilling rigs.
Drilling rig. The machine used to drill a wellbore.
A-1
Drillpipe or Drill pipe. Tubular steel conduit fitted with special threaded ends called tool joints. The drillpipe connects the rig surface equipment with the bottomhole assembly and the bit, both to pump drilling fluid to the bit and to be able to raise, lower and rotate the bottomhole assembly and bit.
Drillstring or Drill string. The combination of the drillpipe, the bottomhole assembly and any other tools used to make the drill bit turn at the bottom of the wellbore.
Horizontal drilling. A subset of the more general term “directional drilling,” used where the departure of the wellbore from vertical exceeds about 80 degrees. Note that some horizontal wells are designed such that after reaching true 90-degree horizontal, the wellbore may actually start drilling upward. In such cases, the angle past 90 degrees is continued, as in 95 degrees, rather than reporting it as deviation from vertical, which would then be 85 degrees. Because a horizontal well typically penetrates a greater length of the reservoir, it can offer significant production improvement over a vertical well.
Hydraulic fracturing. A stimulation treatment routinely performed on oil and gas wells in low-permeability reservoirs. Specially engineered fluids are pumped at high pressure and rate into the reservoir interval to be treated, causing a vertical fracture to open. The wings of the fracture extend away from the wellbore in opposing directions according to the natural stresses within the formation. Proppant, such as grains of sand of a particular size, is mixed with the treatment fluid to keep the fracture open when the treatment is complete. Hydraulic fracturing creates high-conductivity communication with a large area of formation and bypasses any damage that may exist in the near-wellbore area.
Hydrocarbon. A naturally occurring organic compound comprising hydrogen and carbon. Hydrocarbons can be as simple as methane, but many are highly complex molecules, and can occur as gases, liquids or solids. Petroleum is a complex mixture of hydrocarbons. The most common hydrocarbons are natural gas, oil and coal.
Mud motors. A positive displacement drilling motor that uses hydraulic horsepower of the drilling fluid to drive the drill bit. Mud motors are used extensively in directional drilling operations.
Natural gas liquids. Components of natural gas that are liquid at surface in field facilities or in gas-processing plants. Natural gas liquids can be classified according to their vapor pressures as low (condensate), intermediate (natural gasoline) and high (liquefied petroleum gas) vapor pressure.
Nitrogen pumping unit. A high-pressure pump or compressor unit capable of delivering high-purity nitrogen gas for use in oil or gas wells. Two basic types of unit are commonly available: a nitrogen converter unit that pumps liquid nitrogen at high pressure through a heat exchanger or converter to deliver high-pressure gas at ambient temperature, and a nitrogen generator unit that compresses and separates air to provide a supply of high-pressure nitrogen gas.
Plugging. The process of permanently closing oil and gas wells no longer capable of producing in economic quantities. Plugging work can be performed with a well servicing rig along with wireline and cementing equipment; however, this service is typically provided by companies that specialize in plugging work.
Plug. A down-hole packer assembly used in a well to seal off or isolate a particular formation for testing, acidizing, cementing, etc.; also a type of plug used to seal off a well temporarily while the wellhead is removed.
Pressure pumping. Services that include the pumping of liquids under pressure.
Producing formation. An underground rock formation from which oil, natural gas or water is produced. Any porous rock will contain fluids of some sort, and all rocks at considerable distance below the Earth’s surface will initially be under pressure, often related to the hydrostatic column of ground waters above the reservoir. To produce, rocks must also have permeability, or the capacity to permit fluids to flow through them.
Proppant. Sized particles mixed with fracturing fluid to hold fractures open after a hydraulic fracturing treatment. In addition to naturally occurring sand grains, man-made or specially engineered proppants, such as
A-2
resin-coated sand or high-strength ceramic materials like sintered bauxite, may also be used. Proppant materials are carefully sorted for size and sphericity to provide an efficient conduit for production of fluid from the reservoir to the wellbore.
Resource play. Accumulation of hydrocarbons known to exist over a large area.
Shale. A fine-grained, fissile, sedimentary rock formed by consolidation of clay- and silt-sized particles into thin, relatively impermeable layers.
Tight oil. Conventional oil that is found within reservoirs with very low permeability. The oil contained within these reservoir rocks typically will not flow to the wellbore at economic rates without assistance from technologically advanced drilling and completion processes. Commonly, horizontal drilling coupled with multi-stage fracturing is used to access these difficult to produce reservoirs.
Tight sands. A type of unconventional tight reservoir. Tight reservoirs are those which have low permeability, often quantified as less than 0.1 millidarcies.
Tubulars. A generic term pertaining to any type of oilfield pipe, such as drillpipe, drill collars, pup joints, casing, production tubing and pipeline.
Unconventional resource. An umbrella term for oil and natural gas that is produced by means that do not meet the criteria for conventional production. What has qualified as “unconventional” at any particular time is a complex function of resource characteristics, the available exploration and production technologies, the economic environment, and the scale, frequency and duration of production from the resource. Perceptions of these factors inevitably change over time and often differ among users of the term. At present, the term is used in reference to oil and gas resources whose porosity, permeability, fluid trapping mechanism, or other characteristics differ from conventional sandstone and carbonate reservoirs. Coalbed methane, gas hydrates, shale gas, fractured reservoirs and tight gas sands are considered unconventional resources.
Wellbore. The physical conduit from surface into the hydrocarbon reservoir.
Well stimulation. A treatment performed to restore or enhance the productivity of a well. Stimulation treatments fall into two main groups, hydraulic fracturing treatments and matrix treatments. Fracturing treatments are performed above the fracture pressure of the reservoir formation and create a highly conductive flow path between the reservoir and the wellbore. Matrix treatments are performed below the reservoir fracture pressure and generally are designed to restore the natural permeability of the reservoir following damage to the near-wellbore area. Stimulation in shale gas reservoirs typically takes the form of hydraulic fracturing treatments.
Wireline. A general term used to describe well-intervention operations conducted using single-strand or multi-strand wire or cable for intervention in oil or gas wells. Although applied inconsistently, the term commonly is used in association with electric logging and cables incorporating electrical conductors.
Workover. The process of performing major maintenance or remedial treatments on an oil or gas well. In many cases, workover implies the removal and replacement of the production tubing string after the well has been killed and a workover rig has been placed on location. Through-tubing workover operations, using coiled tubing, snubbing or slickline equipment, are routinely conducted to complete treatments or well service activities that avoid a full workover where the tubing is removed. This operation saves considerable time and expense.
A-3
| MAMMOTH ENERGY PARTNERS LP |
||||
| AUDITED CONSOLIDATED FINANCIAL STATEMENTS |
||||
| F-2 | ||||
| F-3 | ||||
| F-4 | ||||
| F-5 | ||||
| F-6 | ||||
| F-7 | ||||
| UNAUDITED CONDENSED CONSOLIDATED FINANCIAL STATEMENTS |
||||
| F-32 | ||||
| CONDENSED CONSOLIDATED STATEMENTS OF COMPREHENSIVE (LOSS) INCOME |
F-33 | |||
| F-34 | ||||
| F-35 | ||||
| F-36 | ||||
| STINGRAY PRESSURE PUMPING LLC AND AFFILIATE |
||||
| AUDITED COMBINED FINANCIAL STATEMENTS |
||||
| F-56 | ||||
| F-57 | ||||
| F-58 | ||||
| F-59 | ||||
| F-60 | ||||
| F-61 | ||||
| UNAUDITED CONDENSED COMBINED FINANCIAL STATEMENTS |
||||
| F-71 | ||||
| F-72 | ||||
| F-73 | ||||
| F-74 | ||||
| F-75 | ||||
| CERTAIN DRILLING RIGS OF LANTERN DRILLING COMPANY |
||||
| F-84 | ||||
| F-85 | ||||
| NOTES TO STATEMENTS OF REVENUES AND DIRECT OPERATING EXPENSES |
F-86 | |||
| MAMMOTH ENERGY SERVICES INC. |
||||
| AUDITED BALANCE SHEET |
||||
| F-88 | ||||
| F-89 | ||||
| F-90 | ||||
F-1
Report of Independent Registered Public Accounting Firm
Board of Directors and Unitholders
Mammoth Energy Partners LP
We have audited the accompanying consolidated balance sheets of Mammoth Energy Partners LP (a Delaware limited partnership) and subsidiaries (the “Partnership”) as of December 31, 2015 and 2014, and the related consolidated statements of comprehensive loss, partners’ interest, and cash flows for the years then ended. These financial statements are the responsibility of the Partnership’s management. Our responsibility is to express an opinion on these financial statements based on our audits.
We conducted our audits in accordance with the standards of the Public Company Accounting Oversight Board (United States). Those standards require that we plan and perform the audit to obtain reasonable assurance about whether the financial statements are free of material misstatement. We were not engaged to perform an audit of the Partnership’s internal control over financial reporting. Our audits included consideration of internal control over financial reporting as a basis for designing audit procedures that are appropriate in the circumstances, but not for the purpose of expressing an opinion on the effectiveness of the Partnership’s internal control over financial reporting. Accordingly, we express no such opinion. An audit also includes examining, on a test basis, evidence supporting the amounts and disclosures in the financial statements, assessing the accounting principles used and significant estimates made by management, as well as evaluating the overall financial statement presentation. We believe that our audits provide a reasonable basis for our opinion.
In our opinion, the consolidated financial statements referred to above present fairly, in all material respects, the financial position of Mammoth Energy Partners LP and subsidiaries as of December 31, 2015 and 2014, and the results of their operations and their cash flows for the years then ended in conformity with accounting principles generally accepted in the United States of America.
/s/ GRANT THORNTON LLP
Oklahoma City, Oklahoma
March 31, 2016
F-2
| December 31, | ||||||||
| 2015 | 2014 | |||||||
| ASSETS | ||||||||
| CURRENT ASSETS |
||||||||
| Cash and cash equivalents |
$ | 3,074,072 | $ | 15,674,492 | ||||
| Accounts receivable, net |
17,797,852 | 49,002,910 | ||||||
| Receivables from related parties |
25,643,781 | 35,142,962 | ||||||
| Inventories |
4,755,661 | 4,220,401 | ||||||
| Prepaid expenses |
4,447,253 | 9,171,113 | ||||||
| Other current assets |
422,219 | 1,002,011 | ||||||
|
|
|
|
|
|||||
| Total current assets |
56,140,838 | 114,213,889 | ||||||
| Property, plant and equipment, net |
273,026,665 | 334,150,453 | ||||||
| Intangible assets, net - customer relationships |
24,309,772 | 32,956,971 | ||||||
| Intangible assets, net - trade names |
6,328,057 | 7,038,900 | ||||||
| Goodwill |
86,043,148 | 86,131,395 | ||||||
| Other non-current assets |
5,137,090 | 6,223,268 | ||||||
|
|
|
|
|
|||||
| Total assets |
$ | 450,985,570 | $ | 580,714,876 | ||||
|
|
|
|
|
|||||
| LIABILITIES AND UNITHOLDERS’ EQUITY | ||||||||
| CURRENT LIABILITIES |
||||||||
| Accounts payable |
$ | 16,046,378 | $ | 50,156,506 | ||||
| Payables to related parties |
6,997,929 | 4,577,348 | ||||||
| Accrued expenses and other current liabilities |
7,718,956 | 16,355,597 | ||||||
| Income taxes payable |
26,912 | 18,635 | ||||||
|
|
|
|
|
|||||
| Total current liabilities |
30,790,175 | 71,108,086 | ||||||
| Long-term debt |
95,000,000 | 146,041,013 | ||||||
| Deferred income taxes, net |
1,460,959 | 7,476,580 | ||||||
| Other liabilities |
571,174 | 878,991 | ||||||
|
|
|
|
|
|||||
| Total liabilities |
127,822,308 | 225,504,670 | ||||||
|
|
|
|
|
|||||
| COMMITMENTS AND CONTINGENCIES (Note 14) |
||||||||
| UNITHOLDERS’ EQUITY |
||||||||
| Unitholders’ Equity: |
||||||||
| General partner |
- | - | ||||||
| Common units, 30,000,000 units issued and outstanding at December 31, 2015 and December 31, 2014 |
329,090,230 | 356,322,355 | ||||||
| Accumulated other comprehensive loss |
(5,926,968) | (1,112,149) | ||||||
|
|
|
|
|
|||||
| Total unitholders’ equity |
323,163,262 | 355,210,206 | ||||||
|
|
|
|
|
|||||
| Total liabilities and unitholders’ equity |
$ | 450,985,570 | $ | 580,714,876 | ||||
|
|
|
|
|
|||||
The accompanying notes are an integral part of these consolidated financial statements.
F-3
MAMMOTH ENERGY PARTNERS LP
CONSOLIDATED STATEMENTS OF COMPREHENSIVE LOSS
| Year Ended December 31, | ||||||||
| 2015 | 2014 | |||||||
| REVENUE |
||||||||
| Services revenue |
$ | 172,012,405 | $ | 182,341,309 | ||||
| Services revenue - related parties |
132,674,989 | 30,834,421 | ||||||
| Product revenue |
16,732,077 | 36,859,731 | ||||||
| Product revenue - related parties |
38,517,222 | 9,490,543 | ||||||
|
|
|
|
|
|||||
| Total revenue |
359,936,693 | 259,526,004 | ||||||
|
|
|
|
|
|||||
| COST AND EXPENSES |
||||||||
| Services cost of revenue (exclusive of depreciation and amortization of $68,053,581 and $31,687,048 for 2015 and 2014, respectively) |
225,820,450 | 150,482,793 | ||||||
| Services cost of revenue (exclusive of depreciation and amortization of $0 and $0 for 2015 and 2014, respectively) - related parties |
4,177,335 | 1,770,565 | ||||||
| Product cost of revenue (exclusive of depreciation and amortization of $4,193,106 and $3,859,150 for 2015 and 2014, respectively) |
25,838,555 | 35,525,596 | ||||||
| Product cost of revenue (exclusive of depreciation and amortization of $0 and $0 for 2015 and 2014, respectively) - related parties |
20,510,977 | 3,289,947 | ||||||
| Selling, general and administrative |
19,303,557 | 14,272,986 | ||||||
| Selling, general and administrative - related parties |
1,237,991 | 2,754,877 | ||||||
| Depreciation and amortization |
72,393,882 | 35,627,165 | ||||||
| Impairment of long-lived assets |
12,124,353 | - | ||||||
|
|
|
|
|
|||||
| Total cost and expenses |
381,407,100 | 243,723,929 | ||||||
|
|
|
|
|
|||||
| Operating (loss) income |
(21,470,407) | 15,802,075 | ||||||
| OTHER INCOME (EXPENSE) |
||||||||
| Interest income |
98,492 | 214,141 | ||||||
| Interest expense |
(5,290,821) | (4,603,595) | ||||||
| Interest expense - related parties |
- | (184,479) | ||||||
| Other, net |
(2,157,764) | (5,724,496) | ||||||
|
|
|
|
|
|||||
| Total other expense |
(7,350,093) | (10,298,429) | ||||||
|
|
|
|
|
|||||
| (Loss) income before income taxes |
(28,820,500) | 5,503,646 | ||||||
| (Benefit) provision for income taxes |
(1,589,086) | 7,514,194 | ||||||
|
|
|
|
|
|||||
| Net loss |
$ | (27,231,414) | $ | (2,010,548) | ||||
|
|
|
|
|
|||||
| OTHER COMPREHENSIVE (LOSS) INCOME |
||||||||
| Foreign currency translation adjustment, net of tax of $0 and $298,170 for 2015 and 2014, respectively |
(4,814,819) | 472,714 | ||||||
|
|
|
|
|
|||||
| Comprehensive loss |
$ | (32,046,233) | $ | (1,537,834) | ||||
|
|
|
|
|
|||||
| Net loss attributable to limited partners per unit (Note 9) |
$ | (0.91) | $ | (0.10) | ||||
| Weighted average number of limited partner units outstanding (Note 9) |
30,000,000 | 21,056,073 | ||||||
| Pro Forma C Corporation Data (unaudited): |
||||||||
| Historical loss before income taxes |
(28,820,500) | 5,503,646 | ||||||
| Pro forma (benefit) provision for income taxes |
(4,058,116) | 12,721,822 | ||||||
|
|
|
|
|
|||||
| Pro forma net loss |
$ | (24,762,384) | $ | (7,218,176) | ||||
|
|
|
|
|
|||||
| Pro forma loss per common share - basic and diluted |
$ | (0.83) | $ | (0.34) | ||||
| Weighted average pro forma shares outstanding - basic and diluted |
30,000,000 | 21,056,073 | ||||||
The accompanying notes are an integral part of these consolidated financial statements.
F-4
CONSOLIDATED STATEMENTS OF PARTNERS’ INTEREST
|
Common Stock |
Contributed Capital- Common Shareholders |
Members’ Equity |
Retained Earnings (Accumulated Deficit) |
Common Partners |
Accumulated Other Comprehensive Loss |
Total | ||||||||||||||||||||||||||
| Shares | Amount | |||||||||||||||||||||||||||||||
| Balance at January 1, 2014 |
100 | $ | 1 | $ | 21,201,185 | $ | 95,168,922 | $ | 5,928,873 | $ | - | $ | (1,584,863) | $ | 120,714,118 | |||||||||||||||||
| Capital contributions |
- | 51,768,502 | - | - | - | 51,768,502 | ||||||||||||||||||||||||||
| Equity based compensation through November 24, 2014 |
- | - | - | 212,537 | - | - | - | 212,537 | ||||||||||||||||||||||||
| Dividends paid |
- | - | - | - | (12,301) | - | - | (12,301) | ||||||||||||||||||||||||
| Net income through November 24, 2014 |
- | - | - | 4,177,882 | 5,210,867 | - | - | 9,388,749 | ||||||||||||||||||||||||
| Contribution of predecessor interest for 20MM units (Note 1) |
(100) | (1) | (21,201,185) | (151,327,843) | (11,127,439) | 180,465,348 | - | (3,191,120) | ||||||||||||||||||||||||
| Acquisition of Stingray (Note 11) |
- | - | - | - | - | 183,630,000 | - | 183,630,000 | ||||||||||||||||||||||||
| Equity based compensation from November 25, 2014 to December 31, 2014 |
- | - | - | - | - | 3,626,304 | - | 3,626,304 | ||||||||||||||||||||||||
| Other comprehensive gain, net of tax |
- | - | - | - | - | - | 472,714 | 472,714 | ||||||||||||||||||||||||
| Net loss from November 25, 2014 to December 31, 2014 |
- | - | - | - | (11,399,297) | - | (11,399,297) | |||||||||||||||||||||||||
|
|
|
|
|
|
|
|
|
|
|
|
|
|
|
|
|
|||||||||||||||||
| Balance at December 31, 2014 |
- | - | - | - | - | 356,322,355 | (1,112,149) | 355,210,206 | ||||||||||||||||||||||||
|
|
|
|
|
|
|
|
|
|
|
|
|
|
|
|
|
|||||||||||||||||
| Net loss |
- | - | - | - | - | (27,231,414) | - | (27,231,414) | ||||||||||||||||||||||||
| Capital distributions |
- | - | - | - | - | (711) | - | (711) | ||||||||||||||||||||||||
| Other comprehensive loss |
- | - | - | - | - | - | (4,814,819) | (4,814,819) | ||||||||||||||||||||||||
|
|
|
|
|
|
|
|
|
|
|
|
|
|
|
|
|
|||||||||||||||||
| Balance at December 31, 2015 |
- | $ | - | $ | - | $ | - | $ | - | $ | 329,090,230 | $ | (5,926,968) | $ | 323,163,262 | |||||||||||||||||
|
|
|
|
|
|
|
|
|
|
|
|
|
|
|
|
|
|||||||||||||||||
The accompanying notes are an integral part of these consolidated financial statements.
F-5
CONSOLIDATED STATEMENTS OF CASH FLOWS
| Year Ended December 31, | ||||||||
| 2015 | 2014 | |||||||
| Cash flows from operating activities |
||||||||
| Net loss |
$ | (27,231,414) | $ | (2,010,548) | ||||
| Adjustments to reconcile net loss to cash provided by operating activities: |
||||||||
| Equity based compensation |
- | 3,838,842 | ||||||
| Depreciation and amortization |
74,868,474 | 38,230,293 | ||||||
| Bad debt expense |
3,682,218 | 603,289 | ||||||
| Loss (gain) on disposal of property and equipment |
1,429,087 | (341,459) | ||||||
| Impairment of long-lived assets |
12,124,353 | - | ||||||
| Deferred income taxes |
(5,717,451) | 5,814,982 | ||||||
| Changes in assets and liabilities, net of effects of acquisition of businesses: |
||||||||
| Accounts receivable, net |
27,522,839 | (4,246,612) | ||||||
| Receivables from related parties |
9,499,181 | (26,985,235) | ||||||
| Inventories |
(2,611,047) | (1,055,660) | ||||||
| Prepaid expenses and other assets |
4,086,044 | (2,233,175) | ||||||
| Accounts payable |
(27,633,817) | (417,121) | ||||||
| Payables to related parties |
2,420,581 | (2,663,197) | ||||||
| Accrued expenses and other current liabilities |
(4,054,709) | 1,834,108 | ||||||
| Income taxes payable |
8,277 | (2,120,793) | ||||||
|
|
|
|
|
|||||
| Net cash provided by operating activities |
68,392,616 | 8,247,714 | ||||||
|
|
|
|
|
|||||
| Cash flows from investing activities: |
||||||||
| Purchases of property and equipment |
(26,251,675) | (111,592,602) | ||||||
| Purchases of property and equipment — related parties |
- | (97,454) | ||||||
| Proceeds from disposal of property and equipment |
1,416,766 | 3,063,803 | ||||||
| Other, net |
- | 2,270 | ||||||
| Business combination cash acquired (Note 11) |
- | 7,059,068 | ||||||
|
|
|
|
|
|||||
| Net cash used in investing activities |
(24,834,909) | (101,564,915) | ||||||
|
|
|
|
|
|||||
| Cash flows from financing activities: |
||||||||
| Borrowings from lines of credit |
14,500,000 | 171,105,155 | ||||||
| Repayments of lines of credit |
(70,430,761) | (35,977,450) | ||||||
| Proceeds from issuance of long-term debt |
- | 32,585,038 | ||||||
| Repayments of long-term debt |
- | (114,014,590) | ||||||
| Debt issuance costs |
- | (2,328,603) | ||||||
| Capital contributions |
- | 51,768,502 | ||||||
| Capital distributions |
(711) | - | ||||||
| Dividends paid |
- | (12,301) | ||||||
|
|
|
|
|
|||||
| Net cash (used in) provided by financing activities |
(55,931,472) | 103,125,751 | ||||||
| Effect of foreign exchange rate on cash |
(226,655) | (2,418,289) | ||||||
|
|
|
|
|
|||||
| Net (decrease) increase in cash and cash equivalents |
(12,600,420) | 7,390,261 | ||||||
| Cash and cash equivalents at beginning of period |
15,674,492 | 8,284,231 | ||||||
|
|
|
|
|
|||||
| Cash and cash equivalents at end of period |
$ | 3,074,072 | $ | 15,674,492 | ||||
|
|
|
|
|
|||||
| Supplemental disclosure of cash flow information: |
||||||||
| Cash paid for interest |
$ | 5,120,482 | $ | 3,492,763 | ||||
| Cash paid for income taxes |
$ | 3,888,470 | $ | 3,709,620 | ||||
| Supplemental disclosure of non-cash transactions: |
||||||||
| Acquisition of Stingray Pressure Pumping and Stingray Logistics (Note 11) |
$ | - | $ | 176,570,932 | ||||
| Purchases of property and equipment included in trade accounts payable |
$ | 740,555 | $ | 7,047,706 | ||||
The accompanying notes are an integral part of these consolidated financial statements.
F-6
Mammoth Energy Partners LP
NOTES TO CONSOLIDATED FINANCIAL STATEMENTS
| 1. | Organization and Basis of Presentation |
Mammoth Energy Partners LP (“Mammoth” or “the Partnership”) is a limited partnership under the laws of the State of Delaware. Mammoth was originally formed by Wexford Capital LP (“Wexford”) in February 2014 as a holding company under the name Redback Energy Services Inc. and was converted to a Delaware limited partnership in August 2014. On November 24, 2014, Wexford (through Mammoth Energy Holdings, LLC a 100% owned subsidiary), Gulfport Energy Corporation (“Gulfport”) and Rhino Resource Partners LP (“Rhino”) (collectively known as “Predecessor Interest”) contributed their interest in the entities presented below to Mammoth in exchange for approximately 20 million limited partner units. Mammoth Energy Partners GP, LLC (the “General Partner”) maintains a non-economic general partner interest.
The following companies (“Operating Entities”) are included in these consolidated financial statements: Bison Drilling and Field Services LLC (“Bison Drilling”), formed November 15, 2010; Bison Trucking LLC (“Bison Trucking”), formed August 9, 2013; White Wing Tubular Services LLC (“White Wing”), formed July 29, 2014; Barracuda Logistics LLC (“Barracuda”), formed October 24, 2014; Mr. Inspections LLC (“MRI”), formed January 25, 2015; Panther Drilling Systems LLC (“Panther”), formed December 11, 2012; Redback Energy Services LLC (“Energy Services”), formed October 6, 2011; Redback Coil Tubing LLC (“Coil Tubing”), formed May 15, 2012; Redback Pump Down Services LLC (“Pump Down”), formed January 16, 2015; Muskie Proppant LLC (“Muskie”), formed September 14, 2011; Stingray Pressure Pumping LLC (“Pressure Pumping”), formed March 20, 2012; Stingray Logistics LLC (“Logistics”), formed November 19, 2012; and Great White Sand Tiger Lodging Ltd. (“Lodging”), formed October 1, 2007. Prior to the contribution, Mammoth did not conduct any material business operations other than certain activities related to the preparation of the registration statement for a proposed initial public offering (“IPO”).
The contribution of all Operating Entities, except Pressure Pumping and Logistics, was treated as a combination of entities under common control. On November 24, 2014 Mammoth acquired Pressure Pumping and Logistics in exchange for approximately 10 million limited partner units. Mammoth acquired Pressure Pumping and Logistics (collectively, the “Stingray Entities”) in exchange for limited partner units representing limited partner interest. Details of the transaction are contained in this report under Note 11: Acquisition of Stingray Entities.
The accompanying consolidated financial statements and related notes of the Partnership include the assets and liabilities of the Operating Entities at their historical carrying values and the results of their operations and cash flows as if they were consolidated for all periods presented, or for the periods from their inception if formed after December 31, 2013.
At December 31, 2015 and December 31, 2014, Wexford, Gulfport and Rhino own 68.72%, 30.5% and 0.78%, respectively, of the limited partner interest in the Partnership.
Operations
The Partnership provides contract land and directional drilling services and completion and production services for oil and natural gas exploration and production. The Partnership’s contract land and directional drilling services provides drilling rigs and directional tools for both vertical and horizontal drilling of oil and natural gas wells. The Partnership’s completion and production services includes coil tubing units used to enhance the flow of oil or natural gas, equipment and personnel used in connection with the completion and early production of oil and natural gas wells, and the production of natural sand proppant that is used primarily for hydraulic fracturing in the oil and gas industry. The Partnership also provides remote accommodation and related services for people working in the oil sands located in Northern Alberta, Canada.
F-7
Mammoth Energy Partners LP
NOTES TO CONSOLIDATED FINANCIAL STATEMENTS
The acquisition of the Stingray Entities adds to our completion and production portfolio. Specifically, by adding hydraulic fracturing and proppant hauling logistics services, the Partnership has developed a diverse offering of operations that can participate in nearly all phases of the oilfield services industry.
All of the Partnership’s operations are in North America. The Partnership operates in the Permian Basin, the Utica Shale, the Eagle Ford Shale, the Marcellus Shale, the Granite Wash, the Cana Woodford Shale, the Cleveland Sand and the oil sands located in Northern Alberta, Canada. The Partnership’s business depends in large part on the conditions in the oil and natural gas industry and, specifically, on the amount of capital spending by its customers. Any prolonged increase or decrease in oil and natural gas prices affects the levels of exploration, development and production activity, as well as the entire health of the oil and natural gas industry. Changes in the commodity prices for oil and natural gas could have a material effect on the Partnership’s results of operations and financial condition.
| 2. | Summary of Significant Accounting Policies |
(a) Principles of Consolidation
The consolidated financial statements are prepared in accordance with accounting principles generally accepted in the United States of America (“U.S. GAAP”). All material intercompany accounts and transactions between the entities within the Partnership have been eliminated.
(b) Use of Estimates
The preparation of financial statements in conformity with U.S. GAAP requires management to make estimates and assumptions that affect the reported amounts of assets and liabilities, the disclosure of contingent assets and liabilities at the date of the financial statements, and the reported amounts of revenues and expenses during the reporting period. Actual results could differ from those estimates. Significant estimates include but are not limited to the allowance for doubtful accounts, reserves for self-insurance, depreciation and amortization of property and equipment, amortization of intangible assets, and future cash flows and fair values used to assess recoverability and impairment of long-lived assets, including goodwill.
(c) Cash and Cash Equivalents
All highly liquid investments with an original maturity of three months or less are considered cash equivalents. The Partnership maintains its cash accounts in financial institutions that are insured by the Federal Deposit Insurance Corporation, with the exception of cash held by Sand Tiger in a Canadian financial institution. Cash balances from time to time may exceed the insured amounts; however the Partnership has not experienced any losses in such accounts and does not believe it is exposed to any significant credit risks on such accounts. The Partnership had $0 and $757,865 of restricted cash included in other current assets in the accompanying Consolidated Balance Sheets at December 31, 2015 and December 31, 2014, respectively. The restricted cash as of December 31, 2014 represented monies held in trust for letters of credit issued to rail car lessors for future lease payments.
(d) Accounts Receivable
Accounts receivable include amounts due from customers for services performed and are recorded as the work progresses. The Partnership grants credit to customers in the ordinary course of business and generally does not require collateral. Most areas in which the Partnership operates provide for a mechanic’s lien
F-8
Mammoth Energy Partners LP
NOTES TO CONSOLIDATED FINANCIAL STATEMENTS
against the property on which the service is performed if the lien is filed within the statutorily specified time frame. Customer balances are generally considered delinquent if unpaid by the 30th day following the invoice date and credit privileges may be revoked if balances remain unpaid.
The Partnership regularly reviews receivables and provides for estimated losses through an allowance for doubtful accounts. In evaluating the level of established reserves, the Partnership makes judgments regarding its customers’ ability to make required payments, economic events, and other factors. As the financial conditions of customers change, circumstances develop, or additional information becomes available, adjustments to the allowance for doubtful accounts may be required. In the event the Partnership was to determine that a customer may not be able to make required payments, the Partnership would increase the allowance through a charge to income in the period in which that determination is made. Uncollectible accounts receivable are periodically charged against the allowance for doubtful accounts once final determination is made of their uncollectability.
Following is a roll forward of the allowance for doubtful accounts for the years December 31, 2015 and 2014:
| Balance, January 1, 2014 |
$ | 1,621,147 | ||
| Additions charged to expense |
603,289 | |||
| Deductions for uncollectible receivables written off |
(1,634,934) | |||
|
|
|
|||
| Balance, December 31, 2014 |
589,502 | |||
| Additions charged to expense |
3,682,218 | |||
| Deductions for uncollectible receivables written off |
(324,288) | |||
|
|
|
|||
| Balance, December 31, 2015 |
$ | 3,947,432 | ||
|
|
|
As discussed in the Footnote 1, prolonged decline in pricing can impact the overall health of the oil and natural gas industry. Year ended December 31, 2015 contained such pricing conditions which may lead to enhanced risk of uncollectiblity on certain receivables. As such, the Partnership has made specific reserves consistent with Partnership policy which resulted in significant additions to allowance for doubtful accounts. The Partnership will continue to pursue collection until such time as final determination is made consistent with Partnership policy.
(e) Inventory
Inventory consists of raw sand and processed sand available for sale, chemicals and other products sold as a bi-product of completion and production operations, and supplies used in performing services. Inventory is stated at the lower of cost or market (net realizable value) on a first-in, first-out basis. The Partnership assess the valuation of its inventories based upon specific usage and future utility.
Inventory also consists of coil tubing strings of various widths, diameters, and lengths that are used in providing specialized services to customers who are primarily operators of oil or gas wells. The strings are used at various rates based on factors such as well conditions (i.e. pressure and friction), vertical and horizontal length of the well, running speed of the string in the well, and total running feet accumulated to the string. The Partnership obtains usage information from data acquisition software and other established assessment methods and attempts to amortize the strings over their estimated useful life. In no event will a
F-9
Mammoth Energy Partners LP
NOTES TO CONSOLIDATED FINANCIAL STATEMENTS
string be amortized over a period longer than 12 months. Amortization of coil strings is included in services cost of revenue in the Consolidated Statements of Comprehensive Loss and totaled $2,075,787 and $1,508,761 for the years ended December 31, 2015 and 2014, respectively.
(f) Prepaid Expenses
Prepaid expenses primarily consist of insurance costs and as of December 31, 2014, payments made to a sand supplier. Insurance costs are expensed over the periods that these costs benefit.
(g) Property and Equipment
Property and equipment, including renewals and betterments, are capitalized and stated at cost, while maintenance and repairs that do not increase the capacity, improve the efficiency or safety, or improve or extend the useful life, are charged to operations as incurred. Disposals are removed at cost, less accumulated depreciation, and any resulting gain or loss is recorded in operations. Depreciation is calculated using the straight-line method over the shorter of the estimated useful life, or the remaining lease term, as applicable. Depreciation does not begin until property and equipment is placed in service. Once placed in service, depreciation on property and equipment continues while being repaired, refurbished, or between periods of deployment.
(h) Long-Lived Assets
The Partnership reviews long-lived assets for recoverability in accordance with the provisions of FASB Accounting Standard Codification (“ASC”) Topic 360, Impairment or Disposal of Long-Lived Assets, which requires that long-lived assets be reviewed for impairment whenever events or changes in circumstances indicate that the carrying amount of the assets may not be recoverable. Recoverability of assets is measured by comparing the carrying amount of an asset to future undiscounted net cash flows expected to be generated by the asset. These evaluations for impairment are significantly impacted by estimates of revenues, costs and expenses, and other factors. If long-lived assets are considered to be impaired, the impairment to be recognized is measured by the amount in which the carrying amount of the assets exceeds the fair value of the assets. In 2015, the Partnership recognized an impairment loss of $9,874,458 on various fixed assets included in Property, plant and equipment, net in the Consolidated Balance Sheets. Additionally, in 2015 the Partnership recognized an impairment loss of $1,904,982 on a terminated long term contractual agreement. No impairments existed in the year ended December 31, 2014.
(i) Goodwill
Goodwill is tested for impairment annually, or more frequently if events or changes in circumstances indicate that goodwill might be impaired. The impairment test is a two-step process. First, the fair value of each reporting unit is compared to its carrying value to determine whether an indication of impairment exists. If impairment is indicated, then the implied value of the reporting unit’s goodwill is determined by allocating the unit’s fair value to its assets and liabilities as if the reporting unit had been acquired in a business combination. The fair value of the reporting unit is determined using the discounted cash flow approach, excluding interest. The impairment for goodwill is measured as the excess of its carrying value over its implied value. Goodwill was tested for impairment as of December 31, 2015. During year ended December 31, 2015 the Partnership had impairments of $88,247. There was no impairment during year ended December 31, 2014.
F-10
Mammoth Energy Partners LP
NOTES TO CONSOLIDATED FINANCIAL STATEMENTS
(j) Amortizable Intangible Assets
Intangible assets subject to amortization include customer relationships and trade names. Customer relationships are amortized based on an estimated attrition factor and trade names are amortized over their estimated useful lives. Amortization expense was $9,101,375 and $938,400 for the years ended December 31, 2015 and 2014. For intangibles acquired in the Stingray acquisition see Note 11: Acquisition of Stingray Entities. During year ended December 31, 2015 the Partnership terminated one customer relationship and impaired the remaining unamortized value of the intangible. The impairment loss recognized was $256,666.
(k) Fair Value of Financial Instruments
The Partnership’s financial instruments consist of cash and cash equivalents, trade receivables, trade payables, amounts receivable or payable to related parties, and long-term debt. The carrying amount of cash and cash equivalents, trade receivables, and trade payables approximates fair value because of the short-term nature of the instruments. The fair value of long-term debt approximates its carrying value based on the borrowing rates currently available to the Partnership for bank loans with similar terms and maturities.
(l) Revenue Recognition
The Partnership generates revenue from multiple sources within its operating segments. In all cases, revenue is recognized when services are performed, collection of the receivable is probable, persuasive evidence of an arrangement exists, and the price is fixed and determinable. Services are sold without warranty or right of return. Taxes assessed on revenue transactions are presented on a net basis and are not included in revenue.
Contract drilling services are provided under daywork or footage contracts, and revenue is recognized as the work progresses based on the days completed or the feet drilled, as applicable. Mobilization revenue and costs for daywork and footage contracts are recognized over the days of actual drilling.
Directional drilling services are provided on a day rate or hourly basis, and revenue is recognized as work progresses. Proceeds from customers for the cost of oilfield downhole rental equipment that is involuntarily damaged or lost in-hole are reflected as revenues.
Completion and production services are typically provided based upon a purchase order, contract or on a spot market basis. Services are provided on a day rate, contracted, or hourly basis, and revenue is recognized as the work progresses. Jobs for these services are typically short-term in nature and range from a few hours to multiple days. Revenue is recognized upon the completion of each day’s work based upon a completed field ticket, which includes the charges for the services performed, mobilization of the equipment to the location and personnel. Additional revenue is generated through labor charges and the sale of consumable supplies that are incidental to the service being performed. The labor charges and the use of consumable supplies are reflected on the completed field tickets.
Revenue from remote accommodation services is recognized when rooms are occupied and services have been rendered. Advanced deposits on rooms and special events are deferred until services are provided to the customer.
The timing of revenue recognition may differ from contract billing or payment schedules, resulting in revenues that have been earned but not billed (“unbilled revenue”) or amounts that have been billed, but not earned (“deferred revenue”). The Partnership had $3,414,853 and $8,243,057 of unbilled revenue included in accounts receivable, net in the Consolidated Balance Sheets at December 31, 2015 and December 31, 2014, respectively. The Partnership had $7,459,988 and $11,310,945 of unbilled revenue included in
F-11
Mammoth Energy Partners LP
NOTES TO CONSOLIDATED FINANCIAL STATEMENTS
receivables from related parties in the Consolidated Balance Sheets at December 31, 2015 and December 31, 2014, respectively. There was $0 and $133,310 of deferred revenue included in accrued expenses and other current liabilities in the Consolidated Balance Sheets at December 31, 2015 and 2014, respectively.
(m) Earnings per Unit
Earnings per unit applicable to limited partners is computed by dividing limited partners’ interest in net loss by the weighted average number of outstanding common units. See Note 9.
(n) Equity-based Compensation
The Partnership records equity-based payments at fair value on the date of grant, and expenses the value of these equity-based payments in compensation expense over the applicable vesting periods. See Note 10.
(o) Income Taxes
Except for Lodging, no provision for federal income tax is included in the accompanying financial statements as federal income taxes, if any, are payable by the members. Limited liability companies are subject to taxation in Texas where the Partnership does business; therefore, the Partnership may provide for income taxes attributable to that state on a current basis.
Lodging is subject to corporate income taxes, and such taxes are provided in the financial statements pursuant to Financial Accounting Standards Board (“FASB”) Accounting Standard Codification (“ASC”) 740, Income Taxes. Under FASB ASC 740, deferred tax assets and liabilities are recognized for the future tax consequences attributable to differences between the financial statement carrying amounts of existing assets and liabilities and their respective tax bases. Deferred tax assets and liabilities are measured using statutory tax rates expected to apply to taxable income in the years in which those temporary differences are expected to be recovered or settled. The effect of deferred tax assets and liabilities as a result of a change in tax rate is recognized in the period that includes the statutory enactment date. A valuation allowance for deferred tax assets is recognized when it is more likely than not that the benefit of deferred tax assets will not be realized.
The Partnership evaluates tax positions taken or expected to be taken in preparation of its tax returns and disallows the recognition of tax positions that do not meet a “more likely than not” threshold of being sustained upon examination by the taxing authorities. During the years ended December 31, 2015 and 2014, no uncertain tax positions existed. Penalties and interest, if any, are recognized in general and administrative expense. The Partnership’s 2015, 2014, 2013 and 2012 income tax returns remain open to examination by the applicable taxing authorities.
(p) Foreign Currency Translation
For foreign operations, assets and liabilities are translated at the period-end exchange rate, and income statement items are translated at the average exchange rate for the period. Resulting translation adjustments are recorded within accumulated other comprehensive loss. Assets and liabilities denominated in foreign currencies, if any, are re-measured at the balance sheet date. Resulting transaction gains or losses are included as a component of current period earnings.
F-12
Mammoth Energy Partners LP
NOTES TO CONSOLIDATED FINANCIAL STATEMENTS
(q) Comprehensive (Loss) Income
Comprehensive (loss) income consists of net (loss) income and other comprehensive (loss) income. Other comprehensive (loss) income included certain changes in equity that are excluded from net (loss) income. Specifically, cumulative foreign currency translation adjustments are included in accumulated other comprehensive (loss) income.
(r) Concentrations of Credit Risk and Significant Customers
Financial instruments that potentially subject the Partnership to concentrations of credit risk consist of cash and cash equivalents in excess of federally insured limits and trade receivables. The Partnership’s accounts receivable have a concentration in the oil and gas industry and the customer base consists primarily of independent oil and natural gas producers. At December 31, 2015 one related party customer from the Completion and Production segment accounted for 56% of the Partnership’s trade accounts receivable and receivables from related parties balance combined. At December 31, 2014 one related party customer from the Completion and Production segment accounted for 42% of the Partnership’s trade accounts receivable and receivables from related parties balance combined. During year ended December 31, 2015 one related party customer from the Completion and Production segment accounted for 47% of the Partnership’s total revenue. No customers accounted for greater than 10% of the Partnership’s total revenue for the year ended December 31, 2014.
(s) Reclassifications
Certain reclassifications have been made to prior period financial statement to conform to current period presentation. These reclassifications have no effect on net income.
(t) Pro Forma Financial Information (unaudited)
The unaudited pro forma financial data presents the estimated impact of the Partnership’s C corporation conversion (“Conversion”) results of operations and financial position attributable to the conversion. The unaudited pro forma financial data have been prepared as if the Conversion occurred as a beginning balance adjustment of the respective period. The unaudited pro forma financial data have been prepared based on the assumption that the Partnership will be treated as a C Corporation for U.S. federal and state income tax purposes.
The pro forma adjustments are based upon currently available information and certain assumptions and estimates; therefore, the actual effects of these transactions will differ from the pro forma adjustments. However, the Partnership’s management considers the applied estimates and assumptions to provide a reasonable basis for the presentation of the significant effects of certain transactions that are expected to have a continuing impact on the Partnership. In addition, the Partnership’s management considers the pro forma adjustments to be factually supportable and to appropriately represent the expected impact of items that are directly attributable to conversion from a Partnership to a C Corporation.
(u) Earnings per Share
As part of the unaudited pro forma financial data, one effect of the Conversion is that Earnings per unit will be replaced by Earnings per Share. The aggregate quantity of equity instruments will be the same from units to shares. Earnings per share applicable to shareholder is computed by dividing shareholders’ interest in net loss by the weighted average number of outstanding common shares.
F-13
Mammoth Energy Partners LP
NOTES TO CONSOLIDATED FINANCIAL STATEMENTS
(v) New Accounting Pronouncements
In November 2015, the Financial Accounting Standards Board (“FASB”) issued Accounting Standards Update (“ASU”) No. 2015-17, “Income Taxes,” which simplifies the presentation of deferred income taxes by requiring deferred tax liabilities and assets be classified as noncurrent in the balance sheet. ASU 2015-17 is effective for annual and interim reporting periods beginning after December 15, 2016, with early adoption permitted. We do not expect the adoption of this guidance to have a material effect on our consolidated financial statements.
In July 2015, the FASB issued ASU No. 2015-11, “Inventory (Topic 330): Simplifying the Measurement of Inventory,” which changes inventory measured using any method other than LIFO or the retail inventory method (for example, inventory measured using first-in, first-out (FIFO) or average cost) at the lower of cost and net realizable value. ASU 2015-11 is effective for annual and interim reporting periods beginning after December 15, 2016, with early adoption permitted. We do not expect the adoption of this guidance to have a material effect on our consolidated financial statements.
In May 2014, the Financial Accounting Standards Board issued Accounting Standards Update (“ASU”) 2014-09, “Revenue from Contracts with Customers.” ASU 2014-09 supersedes existing revenue recognition requirements in GAAP and requires an entity to recognize revenue when it transfers promised goods or services to customers in an amount that reflects the consideration to which the entity expects to be entitled to in exchange for those goods or services. Additionally, it requires expanded disclosures regarding the nature, amount, timing, and certainty of revenue and cash flows from contracts with customers. The ASU was effective for annual and interim reporting periods beginning after December 15, 2016, using either a full or a modified retrospective application approach; however, in July 2015 the FASB decided to defer the effective date by one year (until 2018) by issuing ASU No. 2015-14, “Revenue From Contracts with Customers: Deferral of the Effective Date.” The Partnership is in the process of evaluating the impact on its consolidated financial statements.
In February 2016, the FASB issued ASU No, 2016-2 “Leases” amending the current accounting for leases. Under the new provisions, all lessees will report a right-of-use asset and a liability for the obligation to make payments for all leases with the exception of those leases with a term of 12 months or less. All other leases will fall into one of two categories: (i) a financing lease or (ii) an operating lease. Lessor accounting remains substantially unchanged with the exception that no leases entered into after the effective date will be classified as leveraged leases. For sale leaseback transactions, a sale will only be recognized if the criteria in the new revenue recognition standard are met. ASU 2016-2 is effective for fiscal years beginning after December 15, 2019, and interim periods within fiscal years beginning after December 15, 2020. Early adoption is permitted. The Partnership is currently evaluating the effect the new guidance will have on our consolidated financial statements and results of operations.
| 3. | Inventory |
A summary of the Partnership’s inventory is shown below:
| December 31, | December 31, | |||||||||||
| 2015 | 2014 | |||||||||||
| Raw materials |
$ | 47,701 | $ | 177,946 | ||||||||
| Work in process |
233,719 | 155,587 | ||||||||||
| Finished goods |
52,997 | 1,309,734 | ||||||||||
| Supplies |
4,421,244 | 2,577,134 | ||||||||||
|
|
|
|
|
|||||||||
| Total inventory |
$ | 4,755,661 | $ | 4,220,401 | ||||||||
|
|
|
|
|
|||||||||
F-14
Mammoth Energy Partners LP
NOTES TO CONSOLIDATED FINANCIAL STATEMENTS
| 4. | Property, Plant and Equipment |
Property, plant and equipment include the following:
| December 31, | December 31, | |||||||||||
| Useful Life | 2015 | 2014 | ||||||||||
| Land |
$ | 2,010,555 | $ | 2,164,216 | ||||||||
| Land improvements |
15 years or life of lease | 3,734,178 | 3,717,810 | |||||||||
| Buildings |
15-20 years | 41,218,431 | 45,944,017 | |||||||||
| Drilling rigs and related equipment |
3-15 years | 139,619,078 | 145,085,896 | |||||||||
| Pressure pumping equipment |
3-5 years | 93,956,896 | 89,045,298 | |||||||||
| Coil tubing equipment |
4-10 years | 30,190,216 | 26,221,362 | |||||||||
| Other machinery and equipment |
7-20 years | 37,829,135 | 43,345,930 | |||||||||
| Vehicles, trucks and trailers |
5-10 years | 29,542,164 | 26,872,796 | |||||||||
| Other property and equipment |
3-12 years | 11,169,306 | 4,088,779 | |||||||||
|
|
|
|
|
|||||||||
| 389,269,959 | 386,486,104 | |||||||||||
| Deposits on equipment and equipment in process of assembly |
|
2,072,278 | 8,275,944 | |||||||||
|
|
|
|
|
|||||||||
| 391,342,237 | 394,762,048 | |||||||||||
| Less: accumulated depreciation |
118,315,572 | 60,611,595 | ||||||||||
|
|
|
|
|
|||||||||
| Property, plant and equipment, net |
$ | 273,026,665 | $ | 334,150,453 | ||||||||
|
|
|
|
|
|||||||||
Depreciation expense was $63,292,507 and $34,688,765 for the years ended December 31, 2015 and 2014, respectively.
Deposits on equipment and equipment in process of assembly represents deposits placed with vendors for equipment that is in the process of assembly and purchased equipment that is being outfitted for its intended use. The equipment is not yet placed in service.
| 5. | Goodwill and Intangible Assets |
As of December 31, the Partnership had the following definite lived intangible assets recorded:
| 2015 | 2014 | |||||||
| Customer relationships |
$ | 33,605,000 | $ | 33,885,000 | ||||
| Trade names |
7,110,000 | 7,110,000 | ||||||
| Less: accumulated amortization - customer relationships |
9,295,228 | 928,029 | ||||||
| Less: accumulated amortization - trade names |
781,943 | 71,100 | ||||||
|
|
|
|
|
|||||
| Intangible assets, net |
$ | 30,637,829 | $ | 39,995,871 | ||||
|
|
|
|
|
|||||
F-15
Mammoth Energy Partners LP
NOTES TO CONSOLIDATED FINANCIAL STATEMENTS
Amortization expense for intangible assets was $9,101,375 and $938,400 for the years ended December 31, 2015 and 2014, respectively. The original life of customer relationships range from 4 to 10 years with a remaining average useful life of 4.35 years. Trade names are amortized over a 10 year useful life and as of December 31, 2015 the remaining useful life was 8.92 years.
The majority of the intangible balance at year end 2015 and 2014 is primarily attributable to the Stingray acquisition. The details of which can be found in Note 11: Acquisition of Stingray Entities. Aggregated expected amortization expense for the future periods is expected to be as follows:
| Year ended December 31: | Amount | |||
| 2016 |
$ | 9,071,000 | ||
| 2017 |
9,071,000 | |||
| 2018 |
8,239,652 | |||
| 2019 |
738,500 | |||
| 2020 |
738,500 | |||
| Thereafter |
2,779,177 | |||
|
|
|
|||
| $ | 30,637,829 | |||
|
|
|
|||
Goodwill was $86,043,148 and $86,131,395 at December 31, 2015 and 2014, respectively. The change is due to an impairment of goodwill during year ended December 31, 2015.
| 6. | Accrued Expenses and Other Current Liabilities |
Accrued expense and other current liabilities included the following:
| December 31, | ||||||||
| 2015 | 2014 | |||||||
| Accrued compensation, benefits and related taxes |
$ | 1,349,493 | $ | 3,704,560 | ||||
| Financed insurance premiums |
3,194,564 | 5,538,112 | ||||||
| Other |
3,174,899 | 7,112,925 | ||||||
|
|
|
|
|
|||||
| Total |
$ | 7,718,956 | $ | 16,355,597 | ||||
|
|
|
|
|
|||||
Financed insurance premiums are due in monthly installments, bear interest at rates ranging from 1.79% to 5.00%, are unsecured, and mature within the twelve month period following the close of the year.
| 7. | Debt |
Mammoth Credit Facility
On November 26, 2014 Mammoth entered into a revolving credit and security agreement with a bank for $170 million. The facility matures on November 25, 2019. Borrowings under this facility are secured by the assets of Mammoth, inclusive of the subsidiary companies. The maximum availability of the facility is subject to a borrowing base calculation prepared monthly. Concurrent with the execution of the facility, the initial advance relieved all subordinate debt of the Partnership. Interest is payable monthly at a base rate set by the institution’s commercial lending group plus applicable margin. Additionally, at the Partnership’s request, outstanding balances, are permitted to be converted to LIBOR rate plus applicable margin tranches at set increments of $500,000. The LIBOR rate option allows the Partnership to select a more advantageous interest figure from one, two, and three or six month LIBOR futures spot rates, at the Partnership’s selection
F-16
Mammoth Energy Partners LP
NOTES TO CONSOLIDATED FINANCIAL STATEMENTS
and based upon management’s opinion of prospective lending rates. The applicable margin for either the base rate or the LIBOR rate option can vary from 1.5% to 3.0%, based upon a calculation of the excess availability of the line as a percentage of the maximum credit limit.
At December 31, 2015, $95 million of the outstanding balance of the facility was in a one month LIBOR rate option tranche with an interest rate of 3.04%. As of December 31, 2015 Mammoth had availability of $44,619,551.
At December 31, 2014, $137 million of the outstanding balance of the facility was in a one month LIBOR rate option tranche with an interest rate of 3.16%. Additionally, at December 31, 2014, $8.5 million of the outstanding balance of the facility was in a one month LIBOR rate option tranche with an interest rate of 3.17%. The remaining balance of the facility as of December 31, 2014 accrued interest at a base rate plus margin of 5.25%. The total outstanding balance of the Mammoth facility as of December 31, 2014 was $146,041,013 with availability of $23,619,860.
The Mammoth facility also contains various customary affirmative and restrictive covenants. Among the various covenants are specifically identified financial covenants placing requirements of a minimum interest coverage ratio (3.0 to 1.0), maximum leverage ratio (4.0 to 1.0), and minimum availability ($10MM). As of December 31, 2015, the Partnership was in compliance with all covenants.
Legacy Lines of Credit
Prior to the execution of the Mammoth facility, certain of the Partnership’s Operating Entities had entered into lines of credit and long-term debt agreements with various banks. All debt was collateralized by substantially all assets of the respective Operating Entities. The debt also contained various customary affirmative and restrictive covenants. These lines of credit and long-term debt agreements were extinguished in conjunction with the November 26, 2014 credit facility.
The debt material presented below is provided to detail historical information of Mammoth’s subsidiary entities. All of the following lines of credit and long term debt agreements were relieved with the execution of the Mammoth credit facility on November 25, 2014.
In May 2013, Bison entered into a $5.0 million credit facility with a bank. Borrowings under the revolving credit facility were subject to a borrowing limitation based on 80% of eligible accounts receivable balances which were further limited to a concentration of 40% of total accounts receivable for a related party and 20% of total accounts receivable for all other customers. Bison made monthly interest payments on amounts borrowed under the facility at the greater of prime rate plus 0.75% or 4.25%. In May 2014 Bison amended its facility to increase its size to $7.0 million and extend the maturity date. The revolving credit facility was set to mature on June 1, 2015.
In September 2014, Panther entered into a $4.0 million credit facility with a bank. Borrowings under the facility were secured by certain trade receivables and other assets. Interest was payable monthly at 6.55%, with the first three months interest only and the following 35 months as principal and interest payments. The loan was set to mature on December 8, 2017.
In April 2013, Energy Services amended its revolving credit facility with a bank and increased its size from $1.5 million to $2.0 million. In September 2014 the facility was again amended to increase the size to $3.0 million. The revolving credit facility was set to mature on April 1, 2015. Borrowings under the revolving credit facility were subject to a borrowing base equal to 75% of the outstanding trade receivables of Energy Services. Interest was payable monthly at the greater of the prime rate plus 1.00% or 6.00%.
F-17
Mammoth Energy Partners LP
NOTES TO CONSOLIDATED FINANCIAL STATEMENTS
In June 2013, Energy Services formed a new division known as Redback Pump Downs (“Pump Downs”) and entered into a $1.5 million revolving credit facility with a bank. Borrowings under the revolving credit facility were secured by 75% of the outstanding eligible trade receivables of Pump Downs. Interest was payable monthly at the greater of the prime rate plus 1.00% or 5.25%. The revolving credit facility was set to mature on June 21, 2015.
In October 2013, Energy Services entered into an $8.5 million revolving credit facility with a bank. Borrowings under the revolving credit facility were subject to a borrowing base equal to 60% and 80% of the amount of certain eligible equipment of Energy Services and Pump Downs, respectively. Interest was payable monthly at the greater of prime rate plus 1.00% or 5.25%. In September 2014, $4,630,150 of the outstanding balance of this note was converted to three separate amortizing term loans, described in Long-Term Debt below. The term loans reduced the available amount of the revolving credit facility by the amount outstanding of each loan. The revolving credit facility was set to mature on April 1, 2015.
In October 2013, Coil Tubing entered into a secured loan agreement with a bank which contained a revolving credit facility in the amount of $3.0 million maturing on October 6, 2014. In September 2014, in conjunction with an amendment of corresponding long term debt (referenced below) the facility was extended to mature on September 25, 2015. Borrowings under the revolving credit facility were subject to a borrowing base equal to 80% of Coil Tubing’s’ eligible accounts receivable. Interest was payable monthly at the greater of prime rate or 4.45%.
On January 31, 2013, Muskie entered into a line of credit with a bank in the amount of $3,000,000, which was to mature on February 1, 2014. In January 2014, this line of credit was renewed through February 1, 2015. This credit facility was secured by a real estate mortgage. The Partnership made monthly interest payment on the amounts borrowed under the facility at the prime rate plus 2.0%.
Legacy Long-term Debt
In May 2013, Bison entered into a $30.0 million term loan agreement with a bank. The term loan bore interest at the greater of prime plus 0.75% or 4.5%. Bison was required to make principal payments of $175,000, plus interest, beginning July 1, 2013 and on the first day of each month thereafter through the last day of September 2013. Beginning on October 1, 2013 and on the first day of each month thereafter, Bison was required to make monthly payments pursuant to a 42 month amortization of the remaining principal balance. Effective January 31, 2014, the term loan was amended to increase the face to $51.9 million to facilitate the purchase of additional drilling rigs. In August 2014, the loan was amended to increase the face back to $51.9 million for the purchase of an additional rig. The term loan was set to mature on August 31, 2017.
As referenced in the Line of Credit section above, Energy Services converted $4,630,150 into term loans from their $8.5 million revolving credit facility in September 2014. The loans had the same interest rate and covenants as the preceding credit facility. The three loans that made up this balance were as follows: a $1,750,050 loan amortizing over 36 months, maturing on August 20, 2017; a $1,610,050 loan with three months interest only then amortizing over 36 months, maturing on November 20, 2017; a $1,270,050 loan with six months interest only then amortizing over 36 months, maturing on February 20, 2018.
In October 2013, Coil Tubing entered into a secured loan agreement with a bank to make available up to $8.0 million to purchase specific equipment. In September 2014 this agreement was amended as a guidance line of credit, which provides for advances through the end of the September 25, 2015 maturity date. These advances represented term loans that were interest only for 12 months from advance date and then converted to a 36 month amortized note. As part of the amended agreement the available amount was also raised to
F-18
Mammoth Energy Partners LP
NOTES TO CONSOLIDATED FINANCIAL STATEMENTS
$10.5 million. The facility bore interest at a floating rate of the greater of prime plus a margin that ranged from 0.00% to 1.00% based on the ratio of funded debt to EBITDA, or 4.45%. Additionally, in conjunction with the amended agreement $5,871,459 of the capacity previously drawn was converted into a term note maturing on September 14, 2017. The terms of the note mirrored the overarching facility. Per the agreement the available amount of the line of credit was reduced by the outstanding balance of this corresponding term note.
In July 2014, Redback Energy Services, as borrower, entered into a promissory note with a bank as a lender, for $2.0 million which we sometimes refer to as the July 2014 Redback Facility. The loan accrued interest at a rate of 3.25% per annum and was amortized in 60 monthly installments, with a final maturity date of July 22, 2019. The loan was secured by a security interest in a double fluid pumper trailer and contained certain customary covenants.
In July 2014, Redback Energy Services, as borrower, entered into a mortgage agreement with a bank as a lender for $630,422 to purchase real property in Ohio. The loan held a fixed interest rate of 5.5% was amortized over 180 months, maturing on July 7, 2029.
| 8. | Income Taxes |
The components of income tax (benefit) expense attributable to the Partnership for the years ended December 31, are as follows:
| December 31, | ||||||||
| 2015 | 2014 | |||||||
| U.S. current income tax expense |
$ | 12,861 | $ | 24,805 | ||||
| U.S. deferred income tax (benefit) expense |
(5,625,436) | 5,549,517 | ||||||
| Foreign current income tax expense |
3,878,855 | 1,674,407 | ||||||
| Foreign deferred income tax expense |
144,634 | 265,465 | ||||||
|
|
|
|
|
|||||
| Total |
$ | (1,589,086) | $ | 7,514,194 | ||||
|
|
|
|
|
|||||
F-19
Mammoth Energy Partners LP
NOTES TO CONSOLIDATED FINANCIAL STATEMENTS
Deferred tax assets and liabilities attributable to the Partnership consisted of the following:
| December 31, | ||||||||
| 2015 | 2014 | |||||||
| Deferred tax assets: |
||||||||
| Foreign tax credit |
$ | - | $ | 1,586,873 | ||||
| Other |
86,580 | 73,121 | ||||||
|
|
|
|
|
|||||
| Total deferred tax assets |
86,580 | 1,659,994 | ||||||
| Less: valuation allowance |
- | - | ||||||
|
|
|
|
|
|||||
| Total deferred tax assets |
86,580 | 1,659,994 | ||||||
|
|
|
|
|
|||||
| Deferred tax liabilities: |
||||||||
| Property, plant and equipment |
(1,484,350) | (1,764,756) | ||||||
| Deferred US taxes on Foreign Earnings |
- | (7,049,668) | ||||||
| Other |
(63,189) | (322,150) | ||||||
|
|
|
|
|
|||||
| Total deferred tax liabilities |
(1,547,539) | (9,136,574) | ||||||
|
|
|
|
|
|||||
| Net deferred tax liabilities |
$ | (1,460,959) | $ | (7,476,580) | ||||
|
|
|
|
|
|||||
In recording deferred income tax assets, the Partnership considers whether it is more likely than not that some portion or all of the deferred income tax assets will be realized. The ultimate realization of deferred income tax assets is dependent upon the Partnership’s ability to generate future taxable income during the periods in which those deferred income tax assets would be deductible. The Partnership considers the scheduled reversal of deferred income tax liabilities and projected future taxable income for this determination. The Partnership determined that no valuation allowance was required at December 31, 2015 and 2014. Foreign tax credits may be applied for up to five years. Tax credits as of December 31, 2015 must be utilized by December 31, 2020.
The reconciliation of the income tax provision computed at the Partnership’s effective tax rate is as follows:
| December 31, | ||||||||
| 2015 | 2014 | |||||||
| (Loss) income before income taxes |
$ | (28,820,500) | $ | 5,503,646 | ||||
| Statutory income tax rate |
35% | 35% | ||||||
|
|
|
|
|
|||||
| Expected income tax expense |
(10,087,175) | 1,926,276 | ||||||
| Non taxable entity |
15,455,772 | 713,106 | ||||||
| Change of entity status |
(4,792,243) | 6,379,117 | ||||||
| Foreign income taxes, credits, rate differentials |
(1,369,575) | (2,355,816) | ||||||
| Other |
(795,865) | 851,511 | ||||||
|
|
|
|
|
|||||
| Total tax (benefit) provision |
$ | (1,589,086) | $ | 7,514,194 | ||||
|
|
|
|
|
|||||
F-20
Mammoth Energy Partners LP
NOTES TO CONSOLIDATED FINANCIAL STATEMENTS
| 9. | Earnings Per Unit |
The limited partner units were issued November 24, 2014. However, the net income per common unit on the Consolidated Statements of Comprehensive Loss is based on the net income of the Partnership for the full years presented, since the entities were under common control as described in Note 1.
The Partnership’s net loss is allocated wholly to the limited partner units as the General Partner does not have an economic interest.
Basic net loss per common unit is calculated by dividing net loss by the weighted-average number of common units outstanding during the period. Although units were not issued until November 24, 2014, units issued for common control entities have been calculated in the weight average units outstanding amount as if they were outstanding from the beginning of the periods presented, in conjunction with the treatment of common control entities.
| 2015 | 2014 | |||||||
| Net loss |
$ | (27,231,414) | $ | (2,010,548) | ||||
| Net loss per limited partner unit |
(0.91) | (0.10) | ||||||
| Weighted-average common units outstanding |
30,000,000 | 21,056,073 | ||||||
| 10. | Equity Based Compensation |
Upon formation of certain Operating Entities (including the acquired Stingray entities), specified members of management (“Specified Members”) were granted the right to receive distributions from their respective Operating Entity, after the contribution member’s unreturned capital balance was recovered (referred to as “Payout” provision). Additionally, non-employee members were included in the award class (“Non-Employee Members”).
The Company valued the post Payout distribution rights using the option pricing method as of the grant dates that coincide with the formation of the respective Operating Entities. The exercise price was based on the contributing members’ contribution at the formation date. No dividend yield was included because the Company did not plan to pay dividends. For Coil Tubing, valuation assumptions included a risk free interest rate of 0.59%, and expected life of four years, and an expected volatility of 53.26%. For Energy Services, valuation assumptions included a risk free interest rate of 0.83%, an expected life of four years, and an expected volatility of 70.72%. For Panther, valuation assumptions included a risk free interest rate of 0.47%, and expected life of four years, and an expected volatility of 37.27%.
On November 24, 2014 the awards were modified in conjunction with the contribution of the Operating Entities to Mammoth. Awards are not granted in limited or general partner units. Agreements are for interest in the distributable earnings of Mammoth’s majority limited partner unit holder, Wexford.
Modified and new awards granted were valued as of grant date of November 24, 2014. Incremental value between the old awards and modified awards as of the modification date was examined pursuant to applicable accounting guidance. The Partnership has valued the distributions rights using the option pricing method that utilizes Black-Scholes inputs, which requires the Partnership to make several assumptions. Expected volatility was determined using the historical volatility for a peer group of companies. The
F-21
Mammoth Energy Partners LP
NOTES TO CONSOLIDATED FINANCIAL STATEMENTS
volatility calculations include an average of historical and implied volatility which is then adjusted for differences in leverage for each respective Operating Entity and peer group. Volatility percentages ranged between 25% and 42.5%. The expected term of options was determined based on most likely time to “exit,” as generally defined by sale or initial public offering. The expected term used was 1.6 years at modification date and 1.5 years at December 31, 2014. The risk free rate used was the U.S. Treasury Strip Yield curve rate as of the valuation date. The risk free rate used was 0.4168% for the modification date and 0.4971% for December 31, 2014.
Payout is expected to occur upon an initial public offering or sale of an entity, which is considered not probable under applicable accounting guidance. Therefore, for the awards that contained the Pay-out provision, no compensation cost was recognized as the distribution rights do not vest until Pay-out is reached. For the Specified Member awards, the unrecognized amount, which represents the fair value of the award as of the modification date or grant date, was $2,404,570. For the Non-Employees Member awards, the unrecognized cost, which represents the fair value of the awards as of December 31, 2015 was $16,420,941.
Two Specified Members were issued restricted share units (RSUs) in 2012, with vesting occurring in four equal annual installments beginning January 1, 2013. At the modification date, the RSU’s were cancelled and converted to distribution rights with the vesting provisions removed. As a result, the Partnership recognized $1,361,302 of compensation expense in selling, general, and administrative expense in 2014 in the accompanying Consolidated Statements of Comprehensive Loss.
One Specified Member was granted distribution rights in 2011, with vesting occurring in 50 equal monthly installments beginning November 30, 2011. At the modification date, the vesting provisions of these awards were removed. As a result, the Partnership recognized $53,807 of compensation expense in selling, general, and administrative expense in 2014 in the accompanying Consolidated Statements of Comprehensive Loss.
Three Non-Employee Members were granted distribution rights with Payout provisions in 2012. No expense was recognized in 2013 as Pay-out was deemed to be not probable. Upon modification, the Payout provision was removed. As a result, the Partnership recognized $2,423,733 of compensation expense in selling, general, and administrative expense in 2014 in the accompanying Consolidated Statements of Comprehensive Loss.
| 11. | Acquisition of Stingray Entities |
Description of the Transaction
On November 24, 2014 Mammoth acquired all ownership interests in Stingray Pressure Pumping LLC (“Pressure Pumping”) and Stingray Logistics LLC (“Logistics”). Pressure Pumping was formed March 20, 2012 and Logistics was formed November 19, 2012, as Delaware limited liability companies. Both were formed by Wexford and Gulfport. Mammoth acquired Pressure Pumping and Logistics in exchange for limited partner interests. The acquisition of the Stingray Entities adds to the Partnership’s completion and production segment. The hydraulic fracturing and hauling services provided by these entities compliments our already diverse portfolio of operations, and positions us to provide a wide variety of the service jobs included in the energy services sector.
At the date of acquisition, the total ownership interest in Pressure Pumping and Logistics were converted to 31.96% (9.6MM units) and 1.21% (0.4MM units), respectively, of Mammoth limited partnership interest. The fair value of the Stingray entities provided as consideration was determined with the assistance of external valuation experts as of acquisition date.
F-22
Mammoth Energy Partners LP
NOTES TO CONSOLIDATED FINANCIAL STATEMENTS
At the acquisition date the components of the consideration transferred were as follows:
| Consideration attributable to Stingray Pressure Pumping LLC(1) |
$ | 176,910,000 | ||
| Consideration attributable to Stingray Logistics LLC(1) |
6,720,000 | |||
|
|
|
|||
| Total consideration transferred |
$ | 183,630,000 | ||
|
|
|
| (1) | See summary of acquired assets and liabilities below |
Recording of Assets Acquired and Liabilities Assumed
The transaction was accounted for using the acquisition method of accounting, which requires, among other things, that assets acquired and liabilities assumed be recognized at their fair values as of the acquisition date. The following table summarizes the assets acquired and the liabilities assumed:
| Pressure Pumping | Logistics | Total | ||||||||||||||
| Cash and cash equivalents |
$ | 6,930,597 | $ | 128,471 | $ | 7,059,068 | ||||||||||
| Accounts receivable |
25,904,279 | 2,164,859 | 28,069,138 | |||||||||||||
| Inventories |
1,205,059 | - | 1,205,059 | |||||||||||||
| Other current assets |
2,800,125 | 83,892 | 2,884,017 | |||||||||||||
| Property, plant and equipment(1) |
98,746,182 | 2,783,700 | 101,529,882 | |||||||||||||
| Identifiable intangible assets - customer relationships(2) |
33,610,000 | - | 33,610,000 | |||||||||||||
| Identifiable intangible assets - trade names(2) |
6,880,000 | 230,000 | 7,110,000 | |||||||||||||
| Goodwill(3) |
82,867,545 | 3,175,603 | 86,043,148 | |||||||||||||
| Other Assets |
207,057 | 4,000 | 211,057 | |||||||||||||
|
|
|
|
|
|||||||||||||
| Total assets acquired |
$ | 259,150,844 | $ | 8,570,525 | $ | 267,721,369 | ||||||||||
|
|
|
|
|
|||||||||||||
| Accounts payable and accrued liabilities |
33,428,913 | 729,181 | 34,158,094 | |||||||||||||
| Income taxes payable |
115,000 | 5,000 | 120,000 | |||||||||||||
| Long-term debt |
48,696,931 | 1,116,344 | 49,813,275 | |||||||||||||
|
|
|
|
|
|||||||||||||
| Total liabilities assumed |
$ | 82,240,844 | $ | 1,850,525 | $ | 84,091,369 | ||||||||||
|
|
|
|
|
|||||||||||||
| Net assets acquired |
$ | 176,910,000 | $ | 6,720,000 | $ | 183,630,000 | ||||||||||
|
|
|
|
|
|||||||||||||
| (1) | Property, plant and equipment fair value measurements were prepared by utilizing a combined fair market value and cost approach. The market approach relies on comparability of assets using market data information. The cost approach places emphasis on the physical components and characteristics of the asset. It places reliance |
| (2) | Identifiable intangible assets were measured using a combination of income approaches. Trade names were valued using a “Relief-from-Royalty” method. Contractual and non-contractual customer relationships were valued using a “Multi-period excess earnings” method. Identifiable intangible assets will be amortized over 4-10 years. |
| (3) | Goodwill was the excess of the consideration transferred over the net assets recognized and represents the future economic benefits arising from other assets acquired that could not be individually identified and separately recognized. Goodwill recorded in connection with the acquisition is attributable to assembled workforces and future profitability based on the synergies expected to arise from the acquired entities. |
F-23
Mammoth Energy Partners LP
NOTES TO CONSOLIDATED FINANCIAL STATEMENTS
Since the acquisition date, the businesses acquired have provided the following earnings activity:
| 2015 | 2014 | |||||||||||||||||||
| Pressure Pumping | Logistics |
|
Pressure Pumping | Logistics | ||||||||||||||||
| Revenues |
$ | 166,869,663 | $ | 5,922,131 | $ | 17,731,317 | $ | 635,024 | ||||||||||||
| Net income (loss) |
$ | (4,870,645 | ) | $ | 630,999 | $ | (1,612,370 | ) | $ | 97,525 | ||||||||||
The following table presents unaudited 2014 pro forma information for the Partnership as if the acquisition had occurred as of January 1, 2014:
| 2014 | ||||
| Revenues |
$ | 381,868,708 | ||
| Net loss |
$ | (9,438,437) | ||
The historical financial information was adjusted to give effect to the pro forma events that were directly attributable to the acquisition. As of the year ended December 31, 2014 there were no transaction related costs expensed. The unaudited pro forma consolidated results are not necessarily indicative of what the consolidated results of operations actually would have been had the merger been completed on January 1, 2014. In addition, the unaudited pro forma consolidated results do not purport to project the future results of operations of the consolidated partnership.
| 12. | Acquisition of Lantern Rigs |
On January 29, 2014, Bison acquired five drilling rigs (“Rigs”) directly from the financial institutions that leased the Rigs to the previous owner, Lantern Drilling Company (“Lantern”). The Partnership has treated the acquisition of these assets as a business combination because the assets included a workforce and contract arrangements. The acquisition of these Rigs enhances our contract land and directional drilling segment and represents the Partnership’s commitment to expanding our existing revenue streams when advantageous capital expenditure opportunities arise. At the date of acquisition, the five rigs were valued at $47,225,000. The assets are classified in Property, Plant and Equipment, net in the Consolidated Balance Sheets. After tax the total cash consideration paid for the assets was $50,557,053. The outflow of cash is presented in purchases of property and equipment in the Consolidated Statements of Cash Flows.
From acquisition date to December 31, 2014 these assets have generated $34,698,597 of revenue and $6,873,499 of net income included in the Consolidated Statements of Comprehensive Loss. During 2015 these assets generated $24,262,672 of revenue and $8,352,727 of net income included in the Consolidated Statements of Comprehensive Loss.
The following table presents unaudited 2014 pro forma information for the Partnership as if the acquisition had occurred as of January 1, 2014:
| 2014 | ||||
| Revenues |
$ | 262,461,809 | ||
| Net loss |
$ | (966,952 | ) | |
The historical financial information was adjusted to give effect to the pro forma events that were directly attributable to the acquisition. As of the year ended December 31, 2014 there were no transaction related costs expensed. The unaudited pro forma consolidated results are not necessarily indicative of what the consolidated results of operations actually would have been had the merger been completed on January 1, 2014. In addition, the unaudited pro forma consolidated results do not purport to project the future results of operations of the consolidated partnership.
F-24
Mammoth Energy Partners LP
NOTES TO CONSOLIDATED FINANCIAL STATEMENTS
| 13. | Related Party Transactions |
The Partnership provides directional drilling services to an entity under common ownership. For the years ended December 31, 2015 and 2014, the Partnership recognized revenue from this entity of $0 and $168,673, respectively. Receivables from related parties included $240 from this entity at December 31, 2015 and December 31, 2014.
The Partnership provides directional drilling services to an entity under common ownership. For the years ended December 31, 2015 and December 31, 2014, the Partnership recognized $192,485 and $989,484 of revenue from this entity, respectively. There was no receivable balance at December 31, 2015 or December 31, 2014.
The Partnership provides contract land drilling support services to an entity under common ownership. For the year ended December 31, 2015, the Partnership recognized revenue from this entity of $521,121. The partnership also provides trucking and rental services to this entity. Revenue for these services was $157,624 for year ended December 31, 2015. The Partnership did not provide these services in 2014. There was no receivable balance at December 31, 2015.
The Partnership provides trucking and rental services to an entity under common ownership. For the year ended December 31, 2014, the Partnership recognized revenue from this entity of $232,299. Receivables from related parties included $10,304 from this entity at December 31, 2014. The partnership did not provide these services during 2015.
The Partnership provides contract land drilling support services to an entity under common ownership. For the year ended December 31, 2014, the Partnership recognized revenue from this entity of $3,176,607. Receivables from related parties included $0 from this entity at December 31, 2014. The partnership did not provide these services during 2015.
The Partnership provides lodging and related services to an entity under common ownership. For the years ended December 31, 2015 and 2014, the Partnership recognized $941,522 and $3,809,538 of revenue, respectively from this entity. Receivables from related parties included $906 and $865,520 from this entity at December 31, 2015 and 2014, respectively.
The Partnership sells natural sand proppant to Stingray Pressure Pumping, which was acquired during 2014. Prior to the acquisition of Pressure Pumping the Partnership recognized revenue from the sale of sand of $6,245,323. This activity is included in the Product revenue – related parties total on the Consolidated Statements of Comprehensive Loss. The activity following the acquisition as well as the Muskie receivable balance from Pressure Pumping at December 31, 2014, has been eliminated in the Consolidated Financial Statements.
Energy Services rents equipment to Stingray Pressure Pumping. Prior to the acquisition of Pressure Pumping the Partnership recognized rental revenue of $47,216. This activity is included in the Service revenue – related parties total on the Consolidated Statements of Comprehensive Loss. The activity following the acquisition as well as the Energy Services receivable balance from Pressure Pumping at December 31, 2014, has been eliminated in the Consolidated Financial Statements.
The Partnership sells natural sand proppant to a limited partner of Mammoth. For the years ended December 31, 2015 and 2014, the Partnership recognized $38,181,970 and $3,133,822 of revenue, respectively from this entity. Receivables from related parties included $6,801,548 and $3,133,822 from this entity at December 31, 2015 and 2014, respectively.
F-25
Mammoth Energy Partners LP
NOTES TO CONSOLIDATED FINANCIAL STATEMENTS
The Partnership provided directional drilling services to a limited partner of Mammoth. For the years ended December 31, 2015 and 2014, the Partnership recognized revenue of $3,703,140 and $8,302,362, respectively. Receivables from related parties included $973,873 and $2,426,371 at December 31, 2015 and 2014, respectively.
The Partnership provides completion and production services to a limited partner of Mammoth. For the years ended December 31, 2015 and 2014, the Partnership recognized revenue of $2,548,418 and $1,473,094, respectively. Receivables from related parties included $547,570 and $455,175 at December 31, 2015 and 2014, respectively.
Stingray Pressure Pumping provides services to a limited partner of Mammoth. The activity prior to the acquisition of Pressure Pumping is not included in the consolidated financial statements. The activity following the acquisition is included in Services revenue – related parties. From acquisition to year ended December 31, 2014, Pressure Pumping recognized $12,635,148 of revenue. The amount receivable at December 31, 2014 was $25,562,583. The Partnership recognized revenue of $124,311,188 in 2015 and had receivables of $16,218,713 at December 31, 2015.
An entity under common ownership pays fees to the Partnership to transload sand at a rail transloading facility. Revenue for these services was $122,131 for year ended December 31, 2015. Receivables from related parties included $11,818 at December 31, 2015. The Partnership did not provide these services in 2014.
The Partnership provided iron inspection services to an entity under common ownership. Revenue for these services was $8,973 for year ended December 31, 2015. Receivables from related parties included $8,973 at December 31, 2015. The Partnership did not provide these services in 2014.
The Partnership rents equipment to an entity under common ownership. Revenue for these services was $168,356 for year ended December 31, 2015. There were no receivables from this related parties at December 31, 2015. The Partnership did not provide these services in 2014.
The Partnership purchases and sells natural sand proppant from a related party sand provider. The related party is utilized to supplement sand provided by our facility if any orders placed by our customers are not able to be readily fulfilled, either because of volume or specific grades of sand requested. The Partnership performs similar services for this related party. Revenues from this related party for years ended December 2015 and December 31, 2014 were $335,252 and $111,398, respectively and the receivable amounts as of December 31, 2015 and December 31, 2014 were $128,834 and $111,398, respectively. Product cost of revenue sold for the years ended December 2015 and December 31, 2014 was $20,510,977 and $867,428, respectively and the amounts payable as of December 31, 2015 and December 31, 2014 was $6,505,833 and $867,428, respectively.
Stingray Pressure Pumping purchases sand from a related party. The activity prior to the acquisition of Pressure Pumping is not included in the consolidated financial statements. The activity following the acquisition is included in Services cost of revenue – related parties. From acquisition to year ended December 31, 2014, Pressure Pumping recognized $1,029,974 of expense. The amount payable at December 31, 2014 was $2,879,481. During year ended December 31, 2015 the Partnership recognized $2,685,202 of expense and had a payable of $17,552 at December 31, 2015. During year ended December 31, 2015 the Partnership utilized this entity for transload services as well. The partnership incurred fees of $32,261 and had a payable amount of $32,261 as of December 31, 2015.
F-26
Mammoth Energy Partners LP
NOTES TO CONSOLIDATED FINANCIAL STATEMENTS
Stingray Pressure Pumping rents equipment from a related party. The activity prior to the acquisition of Pressure Pumping is not included in the consolidated financial statements. The activity following the acquisition is included and is included in Services cost of revenue – related parties. From acquisition to year ended December 31, 2014, Pressure Pumping recognized $42,545 of expense. There was no amount payable at December 31, 2014. During year ended December 31, 2015 the Partnership recognized $932,896 of expense and had a payable balance of $12,208.
The Partnership pays fees to an entity under common ownership to transload sand at a rail transloading facility. For the years ended December 31, 2014, the Partnership incurred $453,080 in costs which are included in Product cost of revenue-related parties in the accompanying Consolidated Statements of Comprehensive Loss. Accounts payable-related parties included $41,451 of transloading fees at December 31, 2014. The Partnership did not incur any costs with this counterparty during year ended December 31, 2015.
The Partnership purchases equipment and contracts for repairs and maintenance on equipment from an entity previously under common ownership. As of May 9, 2014 this entity was sold and is no longer a related party. Costs incurred before the sale date have been classified in Service cost of revenue – related party and costs incurred after the sale date have been classified in Service cost of revenue. The entire payable balance as of December 31, 2014 is reflected in Accounts Payables on the balance sheet. The Partnership purchased $97,454 of equipment and incurred $200,300 for repairs and maintenance from the beginning of 2014 to the sale date.
The Partnership rents rotary steerable equipment in connection with its directional drilling services from an entity under common ownership. For the years ended December 31, 2015 and 2014, Cost of services—related parties in the accompanying Consolidated Statements of Comprehensive Loss included $101,206 and $250,322, respectively of such equipment rental costs. The amount payable as of December 31, 2015 and December 31, 2014 was $48,998 and $60,198, respectively.
An entity under common management provides technical services to the Partnership. For the years ended December 31, 2015 and 2014, the Partnership incurred total costs under these arrangements of $165,951 and $2,300,358, respectively. For year ended December 31, 2015 the amount is included in Cost of services—related parties. Of the amount incurred in year ended December 31, 2014, $1,969,439 is included in Cost of product revenue – related parties and $330,919 is included in the Cost of services—related parties in the accompanying Consolidated Statements of Comprehensive Loss. As of December 31, 2015 and 2014, the Partnership owed the affiliate $12,077 and $10,000, respectively, included in payables to related parties in the Consolidated Balance Sheets.
The Partnership leases property from an entity under common ownership. During year ended December 31, 2015 the Partnership incurred costs of $106,800 of which is included in Cost of services—related parties in the accompanying Consolidated Statements of Comprehensive Loss. There was no payable balance as of December 31, 2015.
From time to time, the Partnership pays for goods and services on behalf of related party entities under common control, or these related parties pay for goods and services on behalf of the Partnership. As of December 31, 2015 and 2014 the receivables from related parties related to these arrangements was $951,304 and $2,577,549, respectively. The services provided by the Partnership on behalf of its related parties primarily include payroll expenses. The services provided by its related parties on behalf of the Partnership include technical, administrative and payroll services. The reimbursement amount for indirect
F-27
Mammoth Energy Partners LP
NOTES TO CONSOLIDATED FINANCIAL STATEMENTS
expenses is generally based on estimates of office space provided and time devoted to the Partnership. During the years ended December 31, 2015 and 2014, the Partnership incurred $153,019 and $116,805, respectively, of costs which are included in Service cost of revenue—related parties, in the accompanying Consolidated Statements of Comprehensive Loss. During the years ended December 31, 2015 and 2014, the Partnership incurred $1,237,992 and $2,754,877, respectively, of costs which are included in Selling, general and administrative expenses—related parties, in the accompanying Consolidated Statements of Comprehensive Loss. At December 31, 2015 and 2014 payables to related parties included $369,000 and $718,790, respectively, related to these arrangements.
| 14. | Commitments and Contingencies |
The Partnership leases real estate, rail cars and other equipment under long-term operating leases with varying terms and expiration dates through 2025. Aggregate future minimum lease payments under these non-cancelable operating leases in effect at December 31, 2015 are as follows:
| 2016 |
$ | 3,958,184 | ||
| 2017 |
2,666,046 | |||
| 2018 |
2,060,524 | |||
| 2019 |
1,664,689 | |||
| 2020 |
1,259,362 | |||
| Thereafter |
5,434,326 | |||
|
|
|
|||
| Total minimum lease payments |
$ | 17,043,131 | ||
|
|
|
For the years ended December 31, 2015 and 2014, the Partnership recognized rent expense of $4,457,183 and $3,180,205, respectively.
The Partnership entered into a purchase agreement in 2014 with a sand supplier to begin January 1, 2015 and end December 31, 2016. The Partnership is subject to an annual commitment of 200,000 tons of sand. The future commitment for 2016 under this agreement is $2,800,000.
The Partnership has entered into agreements in which certain key employees would receive bonuses in the event of a sale or initial public offering. The maximum amount that could be paid under these agreements as of December 31, 2015 is $3,000,000 million upon a sale or $2,265,000 million upon an initial public offering.
The Partnership has various letters of credit totaling $754,560 to secure rail car lease payments.
The Partnership partially insures some workers’ compensation and auto claims, which includes medical expenses, lost time and temporary or permanent disability benefits. As of December 31, 2015 the policy requires a $100,000 deductible per occurrence. As of December 31, 2014 the insurance policy required a $250,000 and $100,000 deductible per occurrence for workers’ compensation and auto claims, respectively. The Partnership establishes liabilities for the unpaid deductible portion of claims incurred relating to workers’ compensation and auto liability based on estimates. As of December 31, 2015 and 2014 the policies contained aggregate stop losses of $1,900,000 and $1,113,000, respectively. As of December 31, 2015 and 2014, accrued claims were $739,775 and $60,000, respectively. These estimates may change in the near term as actual claims continue to develop. In connection with the insurance programs, letters of credit of $1,176,000 as of December 31, 2015 and $351,000 as of December 31, 2014 have been issued supporting the retained risk exposure. As of both December 31, 2015 and 2014, these letters of credit were collateralized by substantially all of the assets of the Partnership.
F-28
Mammoth Energy Partners LP
NOTES TO CONSOLIDATED FINANCIAL STATEMENTS
The Partnership is routinely involved in state and local tax audits. During year ended December 31, 2015 the State of Ohio assessed taxes on the purchase of equipment the Company believes is exempt under state law. The Company has appealed the assessment and have a hearing scheduled for November 30, 2016. While we are not able to predict the outcome of the appeal, this matter is not expected to have a material adverse effect on the financial position or results of operations of the Partnership.
On June 3, 2015, a class and collective action lawsuit alleging that we failed to pay a class of workers overtime in compliance with the Fair Labor Standards Act and Ohio law was filed titled William Crigler, et al v. Stingray Pressure Pumping, LLC in the U.S. District Court Southern District of Ohio Eastern Division. We are evaluating the background facts and at this time are not able to predict the outcome of this lawsuit or whether it will have a material impact on our financial position, results of operations or cash flows.
On October 12, 2015, a class and collective action lawsuit alleging that we failed to pay a class of workers overtime in compliance with the Fair Labor Standards Act and Oklahoma law was filed titled William Reynolds, individually and on behalf of all others similarly situated v. Redback Energy Services LLC in the U.S. District Court for the Western District of Oklahoma. We are evaluating the background facts and at this time are not able to predict the outcome of this lawsuit or whether it will have a material impact on our financial position, results of operations or cash flows.
On December 2, 2015, a class and collective action lawsuit alleging that we failed to pay a class of workers overtime in compliance with the Fair Labor Standards Act and Texas law was filed titled John Talamentez, individually and on behalf of all others similarly situated v. Bison Drilling and Field Services LLC in the U.S. District Court Western District of Texas Midland/Odessa Division. We are evaluating the background facts and at this time are not able to predict the outcome of this lawsuit or whether it will have a material impact on our financial position, results of operations or cash flows.
The Partnership is involved in various other legal proceedings in the ordinary course of business. Although we cannot predict the outcome of these proceedings, legal matters are subject to inherent uncertainties and there exists the possibility that the ultimate resolution of these matters could have a material adverse effect on our business, financial condition, result of operations or cash flows.
| 15. | Operating Segments |
The Partnership is organized into four reportable segments based on the nature of services provided and the basis in which management makes business and operating decisions. The Partnership principally provides oilfield services in connection with on-shore drilling of oil and natural gas wells for small to large domestic independent oil and nature gas producers. The Partnership’s four segments consist of contract land and directional drilling services, completion and production-services, completion and production-natural sand proppant production and remote accommodation services.
F-29
Mammoth Energy Partners LP
NOTES TO CONSOLIDATED FINANCIAL STATEMENTS
The following table sets forth certain financial information with respect to the Partnership’s reportable segments:
| Completion and Production | ||||||||||||||||||||
| 2015 |
Contract Land and Directional Drilling Services |
Services | Natural Sand Proppant Production |
Remote Accommodation Services |
Total | |||||||||||||||
| Revenue from external customers |
$ | 68,457,719 | $ | 71,672,961 | $ | 14,272,981 | $ | 34,340,821 | $ | 188,744,482 | ||||||||||
| Revenue from related parties |
$ | 4,574,370 | $ | 127,159,066 | $ | 38,517,222 | $ | 941,553 | $ | 171,192,211 | ||||||||||
| Interest expense |
$ | 2,890,130 | $ | 2,288,256 | $ | 51,476 | $ | 60,959 | $ | 5,290,821 | ||||||||||
| Depreciation and amortization expense |
$ | 24,626,705 | $ | 41,425,262 | $ | 4,200,809 | $ | 2,141,106 | $ | 72,393,882 | ||||||||||
| Impairment of long-lived assets |
$ | 8,917,240 | $ | 1,302,132 | $ | 1,904,981 | $ | - | $ | 12,124,353 | ||||||||||
| Income tax provision |
$ | (184,523) | $ | 76,889 | $ | - | $ | (1,481,452) | $ | (1,589,086) | ||||||||||
| Net income (loss) |
$ | (30,401,338) | $ | (14,062,936) | $ | 524,182 | $ | 16,708,678 | $ | (27,231,414) | ||||||||||
| Total expenditures for property, plant and equipment |
$ | 12,650,831 | $ | 10,937,821 | $ | 171,202 | $ | 2,491,821 | $ | 26,251,675 | ||||||||||
| Goodwill |
$ | - | $ | 86,043,148 | $ | - | $ | - | $ | 86,043,148 | ||||||||||
| Intangible assets, net |
$ | - | $ | 30,637,829 | $ | - | $ | - | $ | 30,637,829 | ||||||||||
| Total Assets |
$ | 118,227,357 | $ | 268,172,256 | $ | 32,726,899 | $ | 31,859,058 | $ | 450,985,570 | ||||||||||
| 2014 |
||||||||||||||||||||
| Revenue from external customers |
$ | 109,295,518 | $ | 55,877,320 | $ | 36,859,731 | $ | 17,168,471 | $ | 219,201,040 | ||||||||||
| Revenue from related parties |
$ | 12,869,425 | $ | 14,155,458 | $ | 9,490,543 | $ | 3,809,538 | $ | 40,324,964 | ||||||||||
| Interest expense |
$ | 3,194,061 | $ | 1,218,126 | $ | 127,988 | $ | 63,420 | $ | 4,603,595 | ||||||||||
| Interest expense from related parties |
$ | - | $ | - | $ | 184,479 | $ | - | $ | 184,479 | ||||||||||
| Depreciation and amortization expense |
$ | 21,319,617 | $ | 8,783,596 | $ | 3,867,024 | $ | 1,656,928 | $ | 35,627,165 | ||||||||||
| Income tax provision |
$ | 77,576 | $ | 29,123 | $ | 4,826 | $ | 7,402,669 | $ | 7,514,194 | ||||||||||
| Net income (loss) |
$ | (7,300,562) | $ | 4,722,476 | $ | 280,782 | $ | 286,756 | $ | (2,010,548) | ||||||||||
| Total expenditures for property, plant and equipment |
$ | 85,801,345 | $ | 11,621,751 | $ | 4,587,464 | $ | 9,679,496 | $ | 111,690,056 | ||||||||||
| Goodwill |
$ | - | $ | 86,131,395 | $ | - | $ | - | $ | 86,131,395 | ||||||||||
| Intangible assets, net |
$ | - | $ | 39,995,871 | $ | - | $ | - | $ | 39,995,871 | ||||||||||
| Total Assets |
$ | 185,218,626 | $ | 315,836,526 | $ | 40,734,019 | $ | 38,925,705 | $ | 580,714,876 | ||||||||||
The contract land and directional drilling services segment provides vertical, horizontal and directional drilling services. The completion and production – services segment provides hydraulic fracturing, pressure control flowback and equipment rental services. The completion and production – natural sand proppant production segment produces and sells sand for use in hydraulic fracturing. The remote accommodation services segment provides housing, kitchen and dining, and recreational service facilities for oilfield workers that are located in remote areas away from readily available lodging.
The contract land and directional drilling services segment primarily services the Permian Basin in West Texas and the Appalachian Basin in Ohio, West Virginia and Pennsylvania. The completion and production – services segment primarily services the Appalachian Basin, the Permian Basin, the Anadarko
F-30
Mammoth Energy Partners LP
NOTES TO CONSOLIDATED FINANCIAL STATEMENTS
Basin, Granite Wash, Mississippi Shale, Cana Woodford Shale and Cleveland Sand in Oklahoma. The completion and production – natural sand proppant production segment primarily services the Appalachian Basin and Permian Basin. The remote accommodation services segment primarily services Canada.
| 16. | Subsequent Events |
On February 5, 2016, a lawsuit alleging that we failed to pay a class of workers overtime in compliance with the Fair Labor Standards Act and Ohio law was filed titled Brian Croniser, Travis Roberts and Eric Kemp v. Redback Energy Services LLC in the U.S. District Court Southern District of Ohio Eastern Division. We are evaluating the background facts and at this time are not able to predict the outcome of this lawsuit or whether it will have a material impact on our financial position, results of operations or cash flows.
The Partnership has evaluated the period after December 31, 2015 through March 31, 2016, the date the financial statements were available to be issued, noting no subsequent events or transactions that required recognition or disclosure in the financial statements other than those discussed above.
F-31
MAMMOTH ENERGY PARTNERS LP
CONDENSED CONSOLIDATED BALANCE SHEETS
| June 30, 2016 (unaudited) |
December 31, 2015 |
|||||||
| ASSETS | ||||||||
| CURRENT ASSETS |
||||||||
| Cash and cash equivalents |
$ | 938,068 | $ | 3,074,072 | ||||
| Accounts receivable, net |
19,318,282 | 17,797,852 | ||||||
| Receivables from related parties |
33,933,501 | 25,643,781 | ||||||
| Inventories |
4,476,480 | 4,755,661 | ||||||
| Prepaid Expenses |
4,979,878 | 4,447,253 | ||||||
| Other current assets |
581,788 | 422,219 | ||||||
|
|
|
|
|
|||||
| Total current assets |
64,227,997 | 56,140,838 | ||||||
| Property, plant and equipment, net |
241,104,996 | 273,026,665 | ||||||
| Intangible assets, net – customer relationships |
20,129,772 | 24,309,772 | ||||||
| Intangible assets, net – trade names |
5,972,557 | 6,328,057 | ||||||
| Goodwill |
86,043,148 | 86,043,148 | ||||||
| Other non-current assets |
5,537,684 | 5,137,090 | ||||||
|
|
|
|
|
|||||
| Total assets |
$ | 423,016,154 | $ | 450,985,570 | ||||
|
|
|
|
|
|||||
| LIABILITIES AND UNITHOLDERS’ EQUITY | ||||||||
| CURRENT LIABILITIES |
||||||||
| Accounts payable |
$ | 19,874,756 | $ | 16,046,378 | ||||
| Payables to related parties |
11,449,112 | 6,997,929 | ||||||
| Accrued expenses and other current liabilities |
11,791,785 | 7,718,956 | ||||||
| Income taxes payable |
11,409 | 26,912 | ||||||
|
|
|
|
|
|||||
| Total current liabilities |
43,127,062 | 30,790,175 | ||||||
| Long-term debt |
82,300,000 | 95,000,000 | ||||||
| Deferred income taxes |
1,596,577 | 1,460,959 | ||||||
| Other liabilities |
373,515 | 571,174 | ||||||
|
|
|
|
|
|||||
| Total liabilities |
127,397,154 | 127,822,308 | ||||||
|
|
|
|
|
|||||
| COMMITMENTS AND CONTINGENCIES (Note 12) |
||||||||
| UNITHOLDERS’ EQUITY |
||||||||
| Unitholders’ Equity: |
||||||||
| General partner |
- | - | ||||||
| Common units, 30,000,000 units issued and outstanding at June 30, 2016 and December 31, 2015 |
299,576,110 | 329,090,230 | ||||||
| Accumulated other comprehensive loss |
(3,957,110) | (5,926,968) | ||||||
|
|
|
|
|
|||||
| Total unitholders’ equity |
295,619,000 | 323,163,262 | ||||||
|
|
|
|
|
|||||
| Total liabilities and unitholders’ equity |
$ | 423,016,154 | $ | 450,985,570 | ||||
|
|
|
|
|
|||||
The accompanying notes are an integral part of these condensed consolidated financial statements.
F-32
MAMMOTH ENERGY PARTNERS LP
CONDENSED CONSOLIDATED STATEMENTS OF COMPREHENSIVE (LOSS) INCOME (unaudited)
| Six Months Ended June 30, | ||||||||
| 2016 | 2015 | |||||||
| REVENUE |
||||||||
| Services revenue |
$ | 46,887,094 | $ | 111,672,225 | ||||
| Services revenue – related parties |
40,714,870 | 73,305,163 | ||||||
| Product revenue |
2,155,807 | 13,373,845 | ||||||
| Product revenue – related parties |
13,688,020 | 21,584,555 | ||||||
|
|
|
|
|
|||||
| Total Revenue |
103,445,791 | 219,935,788 | ||||||
|
|
|
|
|
|||||
| COST AND EXPENSES |
||||||||
| Services cost of revenue (exclusive of depreciation and amortization of $33,543,403 and $33,556,616 for the six months ended June 30, 2016 and 2015, respectively) |
66,264,807 | 132,085,648 | ||||||
| Services cost of revenue (exclusive of depreciation and amortization of $0 and $0 for the six months ended June 30, 2016 and 2015, respectively) – related parties |
4,551,718 | 3,042,931 | ||||||
| Product cost of revenue (exclusive of depreciation and amortization of $2,051,877 and $2,106,656 for the six months ended June 30, 2016 and 2015, respectively) |
3,939,766 | 18,632,060 | ||||||
| Product cost of revenue (exclusive of depreciation and amortization of $0 and $0 for the six months ended June 30, 2016 and 2015, respectively) – related parties |
9,516,307 | 12,102,723 | ||||||
| Selling, general and administrative |
7,664,158 | 9,402,890 | ||||||
| Selling, general and administrative - related parties |
386,637 | 447,691 | ||||||
| Depreciation and amortization |
35,667,383 | 35,736,832 | ||||||
| Impairment of long-lived assets |
1,870,885 | 4,470,781 | ||||||
|
|
|
|
|
|||||
| Total cost and expenses |
129,861,661 | 215,921,556 | ||||||
|
|
|
|
|
|||||
| Operating (loss) income |
(26,415,870) | 4,014,232 | ||||||
| OTHER INCOME (EXPENSE) |
||||||||
| Interest income |
- | 98,242 | ||||||
| Interest expense |
(2,109,205) | (2,806,330) | ||||||
| Other, net |
694,690 | (2,092,485) | ||||||
|
|
|
|
|
|||||
| Total other expense |
(1,414,515) | (4,800,573) | ||||||
|
|
|
|
|
|||||
| Loss before income taxes |
(27,830,385) | (786,341) | ||||||
| Provision for income taxes |
1,683,735 | 1,573,136 | ||||||
|
|
|
|
|
|||||
| Net loss |
$ | (29,514,120) | $ | (2,359,477) | ||||
|
|
|
|
|
|||||
| OTHER COMPREHENSIVE INCOME (LOSS) |
||||||||
| Foreign currency translation adjustment, net of tax of $0 for 2016 and 2015, respectively |
1,969,858 | (1,617,441) | ||||||
|
|
|
|
|
|||||
| Comprehensive loss |
$ | (27,544,262) | $ | (3,976,918) | ||||
|
|
|
|
|
|||||
| Net loss attributable to limited partners per unit (Note 9) |
$ | (0.98) | $ | (0.08) | ||||
| Weighted average number of limited partner units outstanding (Note 9) |
30,000,000 | 30,000,000 | ||||||
| Pro Forma C Corporation Data: |
||||||||
| Historical loss before income taxes |
(27,830,385) | (786,341) | ||||||
| Pro forma provision for income taxes |
(3,287,051) | (3,431,215) | ||||||
|
|
|
|
|
|||||
| Pro forma net (loss) income |
$ | (24,543,334) | $ | 2,644,874 | ||||
|
|
|
|
|
|||||
| Pro forma (loss) income per common share – basic and diluted |
$ | (0.82) | $ | 0.09 | ||||
| Weighted average pro forma shares outstanding – basic and diluted |
30,000,000 | 30,000,000 | ||||||
The accompanying notes are an integral part of these condensed consolidated financial statements.
F-33
MAMMOTH ENERGY PARTNERS LP
CONDENSED CONSOLIDATED STATEMENTS OF PARTNERS’ INTEREST (unaudited)
| Common Stock | Common Partners |
Accumulated Other Comprehensive Income (Loss) |
Total | |||||||||||||||||
| Shares | Amount | |||||||||||||||||||
| Balance at January 1, 2015 |
- | - | $ | 356,322,355 | $ | (1,112,149) | $ | 355,210,206 | ||||||||||||
| Net loss |
- | - | (27,231,414) | - | (27,231,414) | |||||||||||||||
| Capital distributions |
- | - | (711) | - | (711) | |||||||||||||||
| Other comprehensive loss |
- | - | - | (4,814,819) | (4,814,819) | |||||||||||||||
|
|
|
|
|
|
|
|
|
|
|
|||||||||||
| Balance at December 31, 2015 |
- | - | 329,090,230 | (5,926,968) | 323,163,262 | |||||||||||||||
|
|
|
|
|
|
|
|
|
|
|
|||||||||||
| Net loss |
- | - | (29,514,120) | - | (29,514,120) | |||||||||||||||
| Other comprehensive income |
- | - | - | 1,969,858 | 1,969,858 | |||||||||||||||
|
|
|
|
|
|
|
|
|
|
|
|||||||||||
| Balance at June 30, 2016 |
- | - | $ | 299,576,110 | $ | (3,957,110) | $ | 295,619,000 | ||||||||||||
|
|
|
|
|
|
|
|
|
|
|
|||||||||||
The accompanying notes are an integral part of these condensed consolidated financial statements.
F-34
MAMMOTH ENERGY PARTNERS LP
CONDENSED CONSOLIDATED STATEMENTS OF CASH FLOWS (unaudited)
| Six Months Ended June 30, | ||||||||
| 2016 | 2015 | |||||||
| Cash flows from operating activities |
||||||||
| Net loss |
$ | (29,514,120) | $ | (2,359,477) | ||||
| Adjustments to reconcile net loss to cash provided by operating activities: |
||||||||
| Depreciation and amortization |
35,667,383 | 35,736,832 | ||||||
| Amortization of coil tubing strings |
962,302 | 788,882 | ||||||
| Amortization of debt origination costs |
199,403 | 199,403 | ||||||
| Bad debt expense |
1,764,218 | 557,307 | ||||||
| (Gain) loss on disposal of property and equipment |
(710,046) | 1,110,381 | ||||||
| Impairments of long-lived assets |
1,870,885 | 4,470,781 | ||||||
| Deferred income taxes |
40,948 | (668,587) | ||||||
| Changes in assets and liabilities: |
||||||||
| Accounts receivable, net |
(2,376,013) | 15,629,025 | ||||||
| Receivables from related parties |
(8,289,720) | (6,262,186) | ||||||
| Inventories |
(683,121) | (1,524,649) | ||||||
| Prepaid expenses and other assets |
(1,290,305) | 3,722,495 | ||||||
| Accounts payable |
4,022,126 | (8,906,515) | ||||||
| Payables to related parties |
4,443,538 | 748,465 | ||||||
| Accrued expenses and other liabilities |
5,751,006 | 623,420 | ||||||
| Income taxes payable |
(15,503) | 46,339 | ||||||
|
|
|
|
|
|||||
| Net cash provided by operating activities |
11,842,981 | 43,911,916 | ||||||
|
|
|
|
|
|||||
| Cash flows from investing activities: |
||||||||
| Purchases of property and equipment |
(2,548,958) | (20,574,047) | ||||||
| Proceeds from disposal of property and equipment |
3,165,516 | 320,273 | ||||||
|
|
|
|
|
|||||
| Net cash provided by (used in) investing activities |
616,558 | (20,253,774) | ||||||
|
|
|
|
|
|||||
| Cash flows from financing activities: |
||||||||
| Borrowings from lines of credit |
11,150,000 | - | ||||||
| Repayments of lines of credit |
(25,752,516) | (28,648,742) | ||||||
|
|
|
|
|
|||||
| Net cash used in financing activities |
(14,602,516) | (28,648,742) | ||||||
| Effect of foreign exchange rate on cash |
6,973 | 188,462 | ||||||
|
|
|
|
|
|||||
| Net decrease in cash and cash equivalents |
(2,136,004) | (4,802,138) | ||||||
| Cash and cash equivalents at beginning of period |
3,074,072 | 15,674,492 | ||||||
|
|
|
|
|
|||||
| Cash and cash equivalents at end of period |
$ | 938,068 | $ | 10,872,354 | ||||
|
|
|
|
|
|||||
| Supplemental disclosure of cash flow information: |
||||||||
| Cash paid for interest |
$ | 1,965,092 | $ | 2,787,853 | ||||
| Cash paid for income taxes |
$ | 2,035,015 | $ | 1,553,316 | ||||
| Supplemental disclosure of non-cash transactions: |
||||||||
| Purchases of property and equipment included in trade accounts payable |
$ | 414,795 | $ | 1,603,977 | ||||
The accompanying notes are an integral part of these condensed consolidated financial statements.
F-35
NOTES TO CONDENSED CONSOLIDATED FINANCIAL STATEMENTS (unaudited)
| 1. | Organization and Basis of Presentation |
The accompanying unaudited condensed consolidated interim financial statements, were prepared in accordance with the rules and regulations of the Securities and Exchange Commission, and reflect all adjustments, which in the opinion of management are necessary for the fair presentation of the results for the interim periods, on a basis consistent with the annual audited consolidated financial statements. These condensed consolidated interim financial statements should be read in conjunction with the consolidated financial statements and the summary of significant accounting policies and notes thereto included in the 2015 annual consolidated financial statements of Mammoth Energy Partners LP (the “Company”, “Mammoth” or “Partnership”).
Mammoth is a limited partnership formed under the laws of the State of Delaware. Mammoth was originally formed by Wexford Capital LP (“Wexford”) in February 2014 as a holding company under the name Redback Energy Services Inc. and was converted to a Delaware limited partnership in August 2014. On November 24, 2014, Mammoth Energy Holdings, LLC (“Mammoth Holdings,” an entity controlled by Wexford), Gulfport Energy Corporation (“Gulfport”) and Rhino Resource Partners LP (“Rhino”) (collectively known as “Predecessor Interest”) contributed their interest in certain of the entities presented below to Mammoth in exchange for approximately 20 million limited partner units. Mammoth Energy Partners GP, LLC (the “General Partner”) maintains a non-economic general partner interest.
The following companies (“Operating Entities”) are included in these consolidated financial statements: Bison Drilling and Field Services LLC (“Bison Drilling”), formed November 15, 2010; Bison Trucking LLC (“Bison Trucking”), formed August 9, 2013; White Wing Tubular Services LLC (“White Wing”), formed July 29, 2014; Barracuda Logistics LLC (“Barracuda”), formed October 24, 2014; Mr. Inspections LLC (“MRI”), formed January 25, 2015; Panther Drilling Systems LLC (“Panther”), formed December 11, 2012; Redback Energy Services LLC (“Energy Services”), formed October 6, 2011; Redback Coil Tubing LLC (“Coil Tubing”), formed May 15, 2012; Redback Pump Down Services LLC (“Pump Down”), formed January 16, 2015; Muskie Proppant LLC (“Muskie”), formed September 14, 2011; Stingray Pressure Pumping LLC (“Pressure Pumping”), formed March 20, 2012; Stingray Logistics LLC (“Logistics”), formed November 19, 2012; and Great White Sand Tiger Lodging Ltd. (“Lodging”), formed October 1, 2007, Silverback Energy Services LLC (“Silverback”), formed June 8, 2016; Mammoth Energy Services Inc, (“Mammoth Inc.”), formed June 3, 2016. Prior to the contribution, Mammoth did not conduct any material business operations other than certain activities related to the preparation of the registration statement for a proposed initial public offering (“IPO”).
The contribution on November 24, 2014 of all Operating Entities, except Pressure Pumping, Logistics and entities created after contribution, was treated as a combination of entities under common control. On November 24, 2014, Mammoth also acquired Pressure Pumping and Logistics (collectively, the “Stingray Entities”) in exchange for approximately 10 million limited partner units.
The accompanying condensed consolidated financial statements and related notes of the Partnership include the assets and liabilities of the Operating Entities at their historical carrying values and the results of their operations and cash flows as if they were consolidated for all periods presented, or for the periods from their inception if formed after December 31, 2013.
At June 30, 2016 and December 31, 2015, Mammoth Holdings, Gulfport and Rhino own 68.72%, 30.5% and 0.78%, respectively, of the limited partner interest in the Partnership.
F-36
Mammoth Energy Partners LP
NOTES TO CONDENSED CONSOLIDATED FINANCIAL STATEMENTS (unaudited)
Operations
The Partnership provides contract land and directional drilling services and completion and production services for oil and natural gas exploration and production. The Partnership’s contract land and directional drilling services provides drilling rigs and directional tools for both vertical and horizontal drilling of oil and natural gas wells. The Partnership’s completion and production services includes coil tubing units used to enhance the flow of oil or natural gas, equipment and personnel used in connection with the completion and early production of oil and natural gas wells, and the sale, distribution and production of natural sand proppant that is used primarily for hydraulic fracturing in the oil and gas industry. The Partnership also provides remote accommodation and related services for people working in the oil sands located in Northern Alberta, Canada.
The acquisition of the Stingray Entities added to the Partnership’s completion and production portfolio. Specifically, by adding hydraulic fracturing and proppant hauling logistics services, the Partnership has developed a diverse offering of operations that can participate in nearly all phases of the oilfield services industry.
All of the Partnership’s operations are in North America. The Partnership operates in the Permian Basin, the Utica Shale, the Eagle Ford Shale, the Marcellus Shale, the Granite Wash, the Cana-Woodford Shale, the Cleveland Sand and the oil sands located in Northern Alberta, Canada. The Partnership’s business depends in large part on the conditions in the oil and natural gas industry and, specifically, on the amount of capital spending by its customers. Any prolonged increase or decrease in oil and natural gas prices affects the levels of exploration, development and production activity, as well as the entire health of the oil and natural gas industry. Changes in the commodity prices for oil and natural gas could have a material effect on the Partnership’s results of operations and financial condition.
| 2. | Summary of Significant Accounting Policies |
(a) Principles of Consolidation
The condensed consolidated financial statements are prepared in accordance with accounting principles generally accepted in the United States of America (“U.S. GAAP”). All material intercompany accounts and transactions between the entities within the Partnership have been eliminated.
(b) Use of Estimates
The preparation of financial statements in conformity with U.S. GAAP requires management to make estimates and assumptions that affect the reported amounts of assets and liabilities, the disclosure of contingent assets and liabilities at the date of the financial statements, and the reported amounts of revenues and expenses during the reporting period. Actual results could differ from those estimates. Significant estimates include but are not limited to the allowance for doubtful accounts, reserves for self-insurance, depreciation and amortization of property and equipment, amortization of intangible assets, and future cash flows and fair values used to assess recoverability and impairment of long-lived assets, including goodwill.
(c) Cash and Cash Equivalents
All highly liquid investments with an original maturity of three months or less are considered cash equivalents. The Partnership maintains its cash accounts in financial institutions that are insured by the
F-37
Mammoth Energy Partners LP
NOTES TO CONDENSED CONSOLIDATED FINANCIAL STATEMENTS (unaudited)
Federal Deposit Insurance Corporation, with the exception of cash held by Sand Tiger in a Canadian financial institution. Cash balances from time to time may exceed the insured amounts; however the Partnership has not experienced any losses in such accounts and does not believe it is exposed to any significant credit risks on such accounts.
(d) Accounts Receivable
Accounts receivable include amounts due from customers for services performed and are recorded as the work progresses. The Partnership grants credit to customers in the ordinary course of business and generally does not require collateral. Most areas in which the Partnership operates provide for a mechanic’s lien against the property on which the service is performed if the lien is filed within the statutorily specified time frame. Customer balances are generally considered delinquent if unpaid by the 30th day following the invoice date and credit privileges may be revoked if balances remain unpaid.
The Partnership regularly reviews receivables and provides for estimated losses through an allowance for doubtful accounts. In evaluating the level of established reserves, the Partnership makes judgments regarding its customers’ ability to make required payments, economic events, and other factors. As the financial conditions of customers change, circumstances develop, or additional information becomes available, adjustments to the allowance for doubtful accounts may be required. In the event the Partnership was to determine that a customer may not be able to make required payments, the Partnership would increase the allowance through a charge to income in the period in which that determination is made. Uncollectible accounts receivable are periodically charged against the allowance for doubtful accounts once final determination is made of their uncollectability.
Following is a roll forward of the allowance for doubtful accounts for the six months ended June 30, 2016 and year December 31, 2015:
| Balance, January 1, 2015 |
$ | 589,502 | ||
| Additions charged to expense |
3,682,218 | |||
| Deductions for uncollectible receivables written off |
(324,288) | |||
|
|
|
|||
| Balance, December 31, 2015 |
3,947,432 | |||
|
|
|
|||
| Additions charged to expense |
1,764,218 | |||
| Deductions for uncollectible receivables written off |
(92,158) | |||
|
|
|
|||
| Balance, June 30, 2016 |
$ | 5,619,492 | ||
|
|
|
As discussed in the Note 1, prolonged decline in pricing can impact the overall health of the oil and natural gas industry. The six months ended June 30, 2016 contained such pricing conditions which may lead to enhanced risk of uncollectiblity on certain receivables. As such, the Partnership has made specific reserves consistent with Partnership policy which resulted in additions to allowance for doubtful accounts. The Partnership will continue to pursue collection until such time as final determination is made consistent with Partnership policy.
(e) Inventory
Inventory consists of raw sand and processed sand available for sale, chemicals and other products sold as a bi-product of completion and production operations, and supplies used in performing services. Inventory is stated at the lower of cost or market (net realizable value) on a first-in, first-out basis. The Partnership assesses the valuation of its inventories based upon specific usage and future utility.
F-38
Mammoth Energy Partners LP
NOTES TO CONDENSED CONSOLIDATED FINANCIAL STATEMENTS (unaudited)
Inventory also consists of coil tubing strings of various widths, diameters, and lengths that are used in providing specialized services to customers who are primarily operators of oil or gas wells. The strings are used at various rates based on factors such as well conditions (i.e. pressure and friction), vertical and horizontal length of the well, running speed of the string in the well, and total running feet accumulated to the string. The Partnership obtains usage information from data acquisition software and other established assessment methods and attempts to amortize the strings over their estimated useful life. In no event will a string be amortized over a period longer than 12 months. Amortization of coil strings is included in services cost of revenue in the Condensed Consolidated Statements of Comprehensive (Loss) Income and totaled $962,302 and $788,882 for the six months ended June 30, 2016 and 2015, respectively.
(f) Prepaid Expenses
Prepaid expenses primarily consist of insurance costs. Insurance costs are expensed over the periods that these costs benefit.
(g) Property and Equipment
Property and equipment, including renewals and betterments, are capitalized and stated at cost, while maintenance and repairs that do not increase the capacity, improve the efficiency or safety, or improve or extend the useful life are charged to operations as incurred. Disposals are removed at cost, less accumulated depreciation, and any resulting gain or loss is recorded in operations. Depreciation is calculated using the straight-line method over the shorter of the estimated useful life, or the remaining lease term, as applicable. Depreciation does not begin until property and equipment is placed in service. Once placed in service, depreciation on property and equipment continues while being repaired, refurbished, or between periods of deployment.
(h) Long-Lived Assets
The Partnership reviews long-lived assets for recoverability in accordance with the provisions of FASB Accounting Standard Codification (“ASC”) Topic 360, Impairment or Disposal of Long-Lived Assets, which requires that long-lived assets be reviewed for impairment whenever events or changes in circumstances indicate that the carrying amount of the assets may not be recoverable. Recoverability of assets is measured by comparing the carrying amount of an asset to future undiscounted net cash flows expected to be generated by the asset. These evaluations for impairment are significantly impacted by estimates of revenues, costs and expenses, and other factors. If long-lived assets are considered to be impaired, the impairment to be recognized is measured by the amount in which the carrying amount of the assets exceeds the fair value of the assets. For the six months ended June 30, 2016 and 2015, the Partnership recognized an impairment loss of $1,870,885 and $2,565,800, respectively, on various fixed assets included in Property, plant and equipment, net in the Condensed Consolidated Balance Sheets. Additionally, during the six months ended June 30, 2015, the Partnership recognized an impairment loss of $1,904,982 on a terminated long term contractual agreement.
(i) Goodwill
Goodwill is tested for impairment annually, or more frequently if events or changes in circumstances indicate that goodwill might be impaired. The impairment test is a two-step process. First, the fair value of each reporting unit is compared to its carrying value to determine whether an indication of impairment exists. If impairment is indicated, then the implied value of the reporting unit’s goodwill is determined by
F-39
Mammoth Energy Partners LP
NOTES TO CONDENSED CONSOLIDATED FINANCIAL STATEMENTS (unaudited)
allocating the unit’s fair value to its assets and liabilities as if the reporting unit had been acquired in a business combination. The fair value of the reporting unit is determined using the discounted cash flow approach, excluding interest. The impairment for goodwill is measured as the excess of its carrying value over its implied value. Goodwill was tested for impairment as of December 31, 2015. For the six months ended June 30, 2016 and 2015, no impairment losses were recognized. During year ended December 31, 2015, the Partnership recognized impairments of $88,247.
(j) Amortizable Intangible Assets
Intangible assets subject to amortization include customer relationships and trade names. Customer relationships are amortized based on an estimated attrition factor and trade names are amortized over their estimated useful lives.
(k) Fair Value of Financial Instruments
The Partnership’s financial instruments consist of cash and cash equivalents, trade receivables, trade payables, amounts receivable or payable to related parties, and long-term debt. The carrying amount of cash and cash equivalents, trade receivables, and trade payables approximates fair value because of the short-term nature of the instruments. The fair value of long-term debt approximates its carrying value because the cost of borrowing fluctuates based upon market conditions.
(l) Revenue Recognition
The Partnership generates revenue from multiple sources within its operating segments. In all cases, revenue is recognized when services are performed, collection of the receivable is probable, persuasive evidence of an arrangement exists, and the price is fixed and determinable. Services are sold without warranty or right of return. Taxes assessed on revenue transactions are presented on a net basis and are not included in revenue.
Contract drilling services are provided under daywork or footage contracts, and revenue is recognized as the work progresses based on the days completed or the feet drilled, as applicable. Mobilization revenue and costs for daywork and footage contracts are recognized over the days of actual drilling.
Directional drilling services are provided on a day rate or hourly basis, and revenue is recognized as work progresses. Proceeds from customers for the cost of oilfield downhole rental equipment that is involuntarily damaged or lost in-hole are reflected as revenues.
Completion and production services are typically provided based upon a purchase order, contract, or on a spot market basis. Services are provided on a day rate, contracted, or hourly basis, and revenue is recognized as the work progresses. Jobs for these services are typically short-term in nature and range from a few hours to multiple days. Revenue is recognized upon the completion of each day’s work based upon a completed field ticket, which includes the charges for the services performed, mobilization of the equipment to the location, and personnel. Additional revenue is generated through labor charges and the sale of consumable supplies that are incidental to the service being performed. The labor charges and the use of consumable supplies are reflected on the completed field tickets.
Revenue from remote accommodation services is recognized when rooms are occupied and services have been rendered. Advanced deposits on rooms and special events are deferred until services are provided to the customer.
F-40
Mammoth Energy Partners LP
NOTES TO CONDENSED CONSOLIDATED FINANCIAL STATEMENTS (unaudited)
The timing of revenue recognition may differ from contract billing or payment schedules, resulting in revenues that have been earned but not billed (“unbilled revenue”) or amounts that have been billed, but not earned (“deferred revenue”). The Partnership had $3,996,507 and $3,414,853 of unbilled revenue included in accounts receivable, net in the Condensed Consolidated Balance Sheets at June 30, 2016 and December 31, 2015, respectively. The Partnership had $12,386,981 and $7,459,988 of unbilled revenue included in receivables from related parties in the Condensed Consolidated Balance Sheets at June 30, 2016 and December 31, 2015, respectively. There was $5,410,800 and $0 of deferred revenue included in accrued expenses and other current liabilities for deposits received in the Condensed Consolidated Balance Sheets at June 30, 2016 and December 31, 2015, respectively.
(m) Earnings per Unit
Earnings per unit applicable to limited partners is computed by dividing limited partners’ interest in net loss by the weighted average number of outstanding common units. See Note 9.
(n) Equity-based Compensation
The Partnership records equity-based payments at fair value on the date of grant, and expenses the value of these equity-based payments in compensation expense over the applicable vesting periods. See Note 10.
(o) Income Taxes
Mammoth and each of the Operating Entities other than Lodging are treated as a partnership for federal income tax purposes. As a result, essentially all taxable earnings and losses were passed through to its members, and Mammoth did not pay any federal income taxes at the entity level. Mammoth is composed of several single member limited liability companies. These LLCs are subject to taxation in Texas where the Partnership does business; therefore, the Partnership may provide for income taxes attributable to that state on a current basis.
Lodging is subject to corporate income taxes, and such taxes are provided in the financial statements pursuant to Financial Accounting Standards Board (“FASB”) Accounting Standard Codification (“ASC”) 740, Income Taxes. Under FASB ASC 740, deferred tax assets and liabilities are recognized for the future tax consequences attributable to differences between the financial statement carrying amounts of existing assets and liabilities and their respective tax bases. Deferred tax assets and liabilities are measured using statutory tax rates expected to apply to taxable income in the years in which those temporary differences are expected to be recovered or settled. The effect of deferred tax assets and liabilities as a result of a change in tax rate is recognized in the period that includes the statutory enactment date. A valuation allowance for deferred tax assets is recognized when it is more likely than not that the benefit of deferred tax assets will not be realized.
The Partnership evaluates tax positions taken or expected to be taken in preparation of its tax returns and disallows the recognition of tax positions that do not meet a “more likely than not” threshold of being sustained upon examination by the taxing authorities. During the six months ended June 30, 2016 and 2015, no uncertain tax positions existed. Penalties and interest, if any, are recognized in general and administrative expense. The Partnership’s 2015, 2014, 2013 and 2012 income tax returns remain open to examination by the applicable taxing authorities.
Immediately prior to the proposed initial public offering of Mammoth Inc., the Partnership will convert to a limited liability company named Mammoth Energy Partners LLC (“Mammoth LLC”) and all equity
F-41
Mammoth Energy Partners LP
NOTES TO CONDENSED CONSOLIDATED FINANCIAL STATEMENTS (unaudited)
interests in Mammoth LLC will be contributed to Mammoth Inc. and Mammoth LLC will become a wholly owned subsidiary of Mammoth Inc. Mammoth Inc. is a C corporation under the Internal Revenue Code and is subject to income tax. Accordingly, for comparative purposes, the Partnership has included a pro forma provision (benefit) for income taxes assuming it had been taxed as a C corporation in all periods prior to the conversion and contribution. The unaudited pro forma data are presented for informational purposes only, and do not purport to project our results of operations for any future period or its financial position as of any future date.
(p) Foreign Currency Translation
For foreign operations, assets and liabilities are translated at the period-end exchange rate, and income statement items are translated at the average exchange rate for the period. Resulting translation adjustments are recorded within accumulated other comprehensive (loss) income. Assets and liabilities denominated in foreign currencies, if any, are re-measured at the balance sheet date. Resulting transaction gains or losses are included as a component of current period earnings.
(q) Comprehensive (Loss) Income
Comprehensive (loss) income consists of net (loss) income and other comprehensive (loss) income. Other comprehensive (loss) income included certain changes in equity that are excluded from net (loss) income. Specifically, cumulative foreign currency translation adjustments are included in accumulated other comprehensive (loss) income.
(r) Concentrations of Credit Risk and Significant Customers
Financial instruments that potentially subject the Partnership to concentrations of credit risk consist of cash and cash equivalents in excess of federally insured limits and trade receivables. The Partnership’s accounts receivable have a concentration in the oil and gas industry and the customer base consists primarily of independent oil and natural gas producers. At June 30, 2016, one third-party customer accounted for 16% of the Partnership’s trade accounts receivable and receivables from related parties balance combined. At June 30, 2016, related party customers accounted for 64% of the Partnership’s trade accounts receivable and receivables from related parties balance combined. At December 31, 2015, one related party customer accounted for 56% of the Partnership’s trade accounts receivable and receivables from related parties balance combined. During the six months ended June 30, 2016, one related party customer accounted for 49% of the Partnership’s total revenue. Two third-party customers accounted for greater than 10% of the Partnership’s total revenue for six months ended June 30, 2016 at 12% and 11%, respectively.
(s) Pro Forma Financial Information
The unaudited pro forma financial data presents the impact of the conversion of the Partnership to a limited liability company and the contribution of that entity to Mammoth Inc. in connection with the proposed initial public offering of Mammoth Inc. as described in paragraph (o) of this Note 1. The unaudited pro forma condensed consolidated financial data have been prepared as if the conversion and contribution occurred as a beginning balance adjustment of the respective period under review. The unaudited pro forma data have been prepared based on the assumption that the Partnership will be treated as a C Corporation for U.S. federal and state income tax purposes. The unaudited pro forma data have also been prepared based on certain pro forma adjustments to the income tax provision.
The pro forma adjustments are based upon currently available information and certain assumptions and estimates; therefore, the actual effects of the conversion and contribution will differ from the pro forma
F-42
Mammoth Energy Partners LP
NOTES TO CONDENSED CONSOLIDATED FINANCIAL STATEMENTS (unaudited)
adjustments. However, the Partnership’s management considers the applied estimates and assumptions to provide a reasonable basis for the presentation of the significant effects of certain transactions that are expected to have a continuing impact on the Partnership. In addition, the Partnership’s management considers the pro forma adjustments to be factually supportable and to appropriately represent the expected impact of items that are directly attributable to the treatment of the Partnership as a C Corporation.
(t) Earnings per Share
As part of the unaudited pro forma financial data, one effect of the Conversion is that Earnings per Unit will be replaced by Earnings per Share. The aggregate quantity of equity instruments will be the same from units to shares. Earnings per share applicable to shareholders is computed by dividing shareholders’ interest in net loss by the weighted average number of outstanding common shares.
(u) New Accounting Pronouncements
In November 2015, the Financial Accounting Standards Board (“FASB”) issued Accounting Standards Update (“ASU”) No. 2015-17, “Income Taxes,” which simplifies the presentation of deferred income taxes by requiring deferred tax liabilities and assets be classified as noncurrent in the balance sheet. ASU 2015-17 is effective for annual and interim reporting periods beginning after December 15, 2016, with early adoption permitted. We do not expect the adoption of this guidance to have a material effect on the Partnership’s condensed consolidated financial statements.
In July 2015, the FASB issued ASU No. 2015-11, “Inventory (Topic 330): Simplifying the Measurement of Inventory,” which changes inventory measured using any method other than LIFO or the retail inventory method (for example, inventory measured using first-in, first-out (FIFO) or average cost) at the lower of cost and net realizable value. ASU 2015-11 is effective for annual and interim reporting periods beginning after December 15, 2016, with early adoption permitted. We do not expect the adoption of this guidance to have a material effect on the Partnership’s condensed consolidated financial statements.
In May 2014, the FASB issued ASU 2014-09, “Revenue from Contracts with Customers.” ASU 2014-09 supersedes existing revenue recognition requirements in GAAP and requires an entity to recognize revenue when it transfers promised goods or services to customers in an amount that reflects the consideration to which the entity expects to be entitled to in exchange for those goods or services. Additionally, it requires expanded disclosures regarding the nature, amount, timing, and certainty of revenue and cash flows from contracts with customers. The ASU was effective for annual and interim reporting periods beginning after December 15, 2016, using either a full or a modified retrospective application approach; however, in July 2015 the FASB decided to defer the effective date by one year (until 2018) by issuing ASU No. 2015-14, “Revenue From Contracts with Customers: Deferral of the Effective Date.” The Partnership is in the process of evaluating the impact on the Partnership’s condensed consolidated financial statements.
In February 2016, the FASB issued ASU No, 2016-2 “Leases” amending the current accounting for leases. Under the new provisions, all lessees will report a right-of-use asset and a liability for the obligation to make payments for all leases with the exception of those leases with a term of 12 months or less. All other leases will fall into one of two categories: (i) a financing lease or (ii) an operating lease. Lessor accounting remains substantially unchanged with the exception that no leases entered into after the effective date will be classified as leveraged leases. For sale leaseback transactions, a sale will only be recognized if the criteria in the new revenue recognition standard are met. ASU 2016-2 is effective for fiscal years beginning after December 15, 2019, and interim periods within fiscal years beginning after December 15, 2020. Early adoption is permitted. The Partnership is currently evaluating the effect the new guidance will have on the Partnership’s condensed consolidated financial statements and results of operations.
F-43
Mammoth Energy Partners LP
NOTES TO CONDENSED CONSOLIDATED FINANCIAL STATEMENTS (unaudited)
| 3. | Inventory |
A summary of the Partnership’s inventory is shown below:
| June 30, | December 31, | |||||||
| 2016 | 2015 | |||||||
| Supplies |
$ | 4,103,530 | $ | 4,421,244 | ||||
| Raw materials |
75,971 | 47,701 | ||||||
| Work in process |
205,450 | 233,719 | ||||||
| Finished goods |
91,529 | 52,997 | ||||||
|
|
|
|
|
|||||
| Total inventory |
$ | 4,476,480 | $ | 4,755,661 | ||||
|
|
|
|
|
|||||
| 4. | Property, Plant and Equipment |
Property, plant and equipment include the following:
| June 30, | December 31, | |||||||||||
| Useful Life | 2016 | 2015 | ||||||||||
| Land |
$ | 2,010,555 | $ | 2,010,555 | ||||||||
| Land improvements |
15 years or life of lease | 3,640,976 | 3,734,178 | |||||||||
| Buildings |
15-20 years | 43,260,550 | 41,218,431 | |||||||||
| Drilling rigs and related equipment |
3-15 years | 139,274,981 | 139,619,078 | |||||||||
| Pressure pumping equipment |
3-5 years | 95,426,690 | 93,956,896 | |||||||||
| Coil tubing equipment |
4-10 years | 27,815,155 | 30,190,216 | |||||||||
| Other machinery and equipment |
7-20 years | 35,625,378 | 37,829,135 | |||||||||
| Vehicles, trucks and trailers |
5-10 years | 28,980,040 | 29,542,164 | |||||||||
| Other property and equipment |
3-12 years | 11,528,324 | 11,169,306 | |||||||||
|
|
|
|
|
|||||||||
| 387,562,649 | 389,269,959 | |||||||||||
| Deposits on equipment and equipment in process of assembly |
|
1,718,302 | 2,072,278 | |||||||||
|
|
|
|
|
|||||||||
| 389,280,951 | 391,342,237 | |||||||||||
| Less: accumulated depreciation |
|
148,175,955 | 118,315,572 | |||||||||
|
|
|
|
|
|||||||||
| Property, plant and equipment, net |
|
$ | 241,104,996 | $ | 273,026,665 | |||||||
|
|
|
|
|
|||||||||
Depreciation expense was $31,131,883 and $31,177,957 for the six months ended June 30, 2016 and 2015, respectively.
Deposits on equipment and equipment in process of assembly represents deposits placed with vendors for equipment that is in the process of assembly and purchased equipment that is being outfitted for its intended use. The equipment is not yet placed in service.
F-44
Mammoth Energy Partners LP
NOTES TO CONDENSED CONSOLIDATED FINANCIAL STATEMENTS (unaudited)
| 5. | Goodwill and Intangible Assets |
The Partnership had the following definite lived intangible assets recorded:
| June 30, 2016 |
December 31, 2015 |
|||||||
| Customer relationships |
$ 33,605,000 | $ | 33,605,000 | |||||
| Trade names |
7,110,000 | 7,110,000 | ||||||
| Less: accumulated amortization - customer relationships |
13,475,228 | 9,295,228 | ||||||
| Less: accumulated amortization - trade names |
1,137,443 | 781,943 | ||||||
|
|
|
|
|
|||||
| Intangible assets, net |
$ 26,102,329 | $ | 30,637,829 | |||||
|
|
|
|
|
|||||
Amortization expense for intangible assets was $4,535,500 and $4,558,875 for the six months ended June 30, 2016 and 2015, respectively. The original life of customer relationships range from 4 to 10 years with a remaining average useful life of 3.85 years. Trade names are amortized over a 10 year useful life and as of June 30, 2016 the remaining useful life was 8.40 years.
Aggregated expected amortization expense for the future periods is expected to be as follows:
| Year ended December 31: | Amount | |||
| Remainder of 2016 |
$ | 4,535,503 | ||
| 2017 |
9,071,004 | |||
| 2018 |
8,224,005 | |||
| 2019 |
738,504 | |||
| 2020 |
738,504 | |||
| Thereafter |
2,794,809 | |||
|
|
|
|||
| $ | 26,102,329 | |||
|
|
|
|||
Goodwill was $86,043,148 at June 30, 2016 and December 31, 2015.
| 6. | Accrued Expenses and Other Current Liabilities |
Accrued expense and other current liabilities included the following:
| June 30, | December 31, | |||||||
| 2016 | 2015 | |||||||
| Deferred revenue |
$ | 5,410,800 | $ | - | ||||
| Accrued compensation, benefits and related taxes |
1,717,357 | 1,349,493 | ||||||
| Financed insurance premiums |
1,069,833 | 3,194,564 | ||||||
| Other |
3,593,795 | 3,174,899 | ||||||
|
|
|
|
|
|||||
| Total |
$ | 11,791,785 | $ | 7,718,956 | ||||
|
|
|
|
|
|||||
Financed insurance premiums are due in monthly installments, bear interest at rates ranging from 1.79% to 5.00%, are unsecured, and mature within the twelve month period following the close of the year.
F-45
Mammoth Energy Partners LP
NOTES TO CONDENSED CONSOLIDATED FINANCIAL STATEMENTS (unaudited)
| 7. | Debt |
Mammoth Credit Facility
On November 25, 2014, Mammoth entered into a revolving credit and security agreement with a bank that provides for maximum borrowings of $170.0 million. The facility matures on November 25, 2019. Borrowings under this facility are secured by the assets of Mammoth, inclusive of the subsidiary companies. The maximum availability of the facility is subject to a borrowing base calculation prepared monthly. Concurrent with the execution of the facility, the initial advance was used to repay all the debt of the Partnership then outstanding. Interest is payable monthly at a base rate set by the institution’s commercial lending group plus applicable margin. Additionally, at the Partnership’s request, outstanding balances are permitted to be converted to LIBOR rate plus applicable margin tranches at set increments of $500,000. The LIBOR rate option allows the Partnership to select a more advantageous interest figure from one, two, three or six month LIBOR futures spot rates, at the Partnership’s selection and based upon management’s opinion of prospective lending rates. The applicable margin for either the base rate or the LIBOR rate option can vary from 1.5% to 3.0%, based upon a calculation of the excess availability of the line as a percentage of the maximum credit limit.
At June 30, 2016, $82.3 million was outstanding under the facility, of which $80.0 million of the outstanding balance of the facility was in a one month LIBOR rate option tranche with an interest rate of 3.19% and $2.3 million of the outstanding balance of the facility accrued interest at a base rate plus margin of 5.25%. As of June 30, 2016 Mammoth had availability of $55.4 million.
At December 31 2015, $95.0 million of the outstanding balance of the facility was in a one month LIBOR rate option tranche with an interest rate of 3.04%. As of December 31, 2015 Mammoth had availability of $44.6 million.
The Mammoth facility also contains various customary affirmative and restrictive covenants. Among the various covenants are specifically identified financial covenants placing requirements of a minimum interest coverage ratio (3.0 to 1.0), maximum leverage ratio (4.0 to 1.0), and minimum availability ($10 million). As of December 31, 2015 and June 30, 2016, the Partnership was in compliance with its covenants under the facility.
| 8. | Income Taxes |
The components of income tax expense attributable to the Partnership for the six months ended June 30, are as follows:
| Six Months Ended June 30, 2016 | ||||||||
| 2016 | 2015 | |||||||
| U.S. current income tax (benefit) expense |
$ | (12,880) | $ | (1,219,883) | ||||
| U.S. deferred income tax expense |
9,786 | 617,214 | ||||||
| Foreign current income tax expense |
1,654,184 | 2,159,320 | ||||||
| Foreign deferred income tax expense |
32,645 | 16,485 | ||||||
|
|
|
|
|
|||||
| Total |
$ | 1,683,735 | $ | 1,573,136 | ||||
|
|
|
|
|
|||||
F-46
Mammoth Energy Partners LP
NOTES TO CONDENSED CONSOLIDATED FINANCIAL STATEMENTS (unaudited)
In recording deferred income tax assets, the Partnership considers whether it is more likely than not that some portion or all of the deferred income tax assets will be realized. The ultimate realization of deferred income tax assets is dependent upon the Partnership’s ability to generate future taxable income during the periods in which those deferred income tax assets would be deductible. The Partnership considers the scheduled reversal of deferred income tax liabilities and projected future taxable income for this determination. The Partnership determined that no valuation allowance was required at June 30, 2016 and 2015. Foreign tax credits may be applied for up to five years. Tax credits as of June 30, 2016 must be utilized by June 30, 2021.
The Partnership is classified as a partnership for income tax purposes. Accordingly, income taxes on net earnings were payable by members and are not reflected in historical financial statements except for taxes associated with a taxable subsidiary. Pro forma adjustments are reflected to provide for income taxes in accordance with ASC 740. For unaudited pro forma income tax calculations, a statutory Federal tax rate of 35% and actual state “as if” rates were used for the pro forma enacted tax rate. The pro forma tax effects are based upon currently available information and assume the Company had been a taxable entity in the periods presented. Management believes that these assumptions provide a reasonable basis for presenting the pro forma effects. Based on estimates of the temporary differences as of June 30, 2016, upon conversion to a taxable entity, net deferred income tax liabilities of approximately $59,500,000 will be recognized with a corresponding charge to earnings. This charge has not been reflected in the pro forma adjustments.
| 9. | Earnings Per Unit |
The limited partner units were issued November 24, 2014. However, the net income per common unit on the Condensed Consolidated Statements of Comprehensive (Loss) Income is based on the net income of the Partnership for the full years presented, since the entities were under common control as described in Note 1.
The Partnership’s net loss is allocated wholly to the limited partner units as the General Partner does not have an economic interest.
| Six Months Ended June 30, 2016 | ||||||||
| 2016 | 2015 | |||||||
| Net Loss |
$ | (29,514,120) | $ | (2,359,477) | ||||
| Net Loss per limited partner unit |
$ | (0.98) | $ | (0.08) | ||||
| Weighted-average common units outstanding |
30,000,000 | 30,000,000 | ||||||
Basic net loss per common unit is calculated by dividing net loss by the weighted-average number of common units outstanding during the period. Although units were not issued until November 24, 2014, units issued for common control entities have been calculated in the weight average units outstanding amount as if they were outstanding from the beginning of the periods presented, in conjunction with the treatment of common control entities.
Pro forma basic and diluted income (loss) per share has been computed by dividing net income (loss) attributable to the Partnership by the number of shares of common stock determined as if the shares of common stock issued were outstanding for all periods presented. Management believes that these assumptions provide a reasonable basis for presenting the pro forma effects.
F-47
Mammoth Energy Partners LP
NOTES TO CONDENSED CONSOLIDATED FINANCIAL STATEMENTS (unaudited)
| 10. | Equity Based Compensation |
Upon formation of certain Operating Entities (including the acquired Stingray Entities), specified members of management (“Specified Members”) were granted the right to receive distributions from their respective Operating Entity, after the contribution member’s unreturned capital balance was recovered (referred to as “Payout” provision). Additionally, non-employee members were included in the award class (“Non-Employee Members”).
On November 24, 2014, the awards were modified in conjunction with the contribution of the Operating Entities to Mammoth. Awards are not granted in limited or general partner units. Agreements are for interest in the distributable earnings of Mammoth’s majority limited partner unit holder.
Payout is expected to occur upon an initial public offering or sale of an entity, which is considered not probable until the event occurs. Therefore, for the awards that contained the Payout provision, no compensation cost was recognized as the distribution rights do not vest until Payout is reached. For the Specified Member awards, the unrecognized amount, which represents the fair value of the award as of the modification dates or grant date, was $3,095,413. For the Non-Employees Member awards, the unrecognized cost, which represents the fair value of the awards as of June 30, 2016 was $15,229,104.
| 11. | Related Party Transactions |
Transactions between the subsidiaries of the Partnership and the following companies are included in Related Party Transactions: Gulfport; Grizzly Oil Sands ULC (“Grizzly”); Taylor Frac LLC (“Taylor”); El Toro (“El Toro”); Stingray Cementing, LLC (“Cementing”); Diamondback E&P, LLC (“Diamondback”); Stingray Energy Services, LLC (“SR Energy”); Everest Operations Management, LLC (“Everest”); Elk City Yard, LLC (“Elk City Yard”); Double Barrel Downhole Technologies, LLC (“DBDHT”); Orange Leaf Holdings LLC (“Orange Leaf”); Caliber Investment Group, LLC (“Caliber”); and Dunvegan North Oilfield Services ULC (“Dunvegan”).
| REVENUES | ACCOUNTS RECEIVABLE | |||||||||||||||||||||||
| Six months ended | Year Ended | |||||||||||||||||||||||
| June 30, | December 31, | June 30, | December 31, | |||||||||||||||||||||
| 2016 | 2015 | 2015 | 2016 | 2015 | ||||||||||||||||||||
| Pressure Pumping and Gulfport |
(a) | $ | 38,165,558 | $ | 68,202,649 | $ | 124,311,188 | $ | 23,957,442 | $ | 16,218,713 | |||||||||||||
| Muskie and Gulfport |
(b) | 11,231,344 | 21,489,318 | 38,181,970 | 7,248,778 | 6,801,548 | ||||||||||||||||||
| Panther Drilling and Gulfport |
(c) | 1,221,022 | 1,784,402 | 3,703,140 | 667,047 | 973,873 | ||||||||||||||||||
| Energy Services and Gulfport |
(d) | - | 1,654,640 | 2,548,418 | 3,663 | 547,570 | ||||||||||||||||||
| Lodging and Grizzly |
(e) | 572 | 938,587 | 941,552 | 270 | 906 | ||||||||||||||||||
| Bison Drilling and El Toro |
(f) | 371,873 | 408,257 | 521,121 | - | - | ||||||||||||||||||
| Muskie and Taylor |
(g) | 2,456,676 | 95,236 | 335,252 | - | 128,834 | ||||||||||||||||||
| Panther Drilling and El Toro |
(f) | 171,619 | 143,680 | 192,485 | 11,644 | - | ||||||||||||||||||
| Energy Services and El Toro |
(f) | 249,193 | - | 168,356 | 202,675 | - | ||||||||||||||||||
| Bison Trucking and El Toro |
(f) | 130,000 | 100,000 | 144,905 | - | - | ||||||||||||||||||
| Barracuda and Taylor |
(h) | 64,258 | 72,949 | 122,131 | - | 11,818 | ||||||||||||||||||
| White Wing and El Toro |
(f) | 20,431 | - | 12,719 | - | - | ||||||||||||||||||
| MRI and Cementing |
(i) | - | - | 8,973 | - | 8,973 | ||||||||||||||||||
| White Wing and Diamondback |
(j) | 1,650 | - | - | - | - | ||||||||||||||||||
| Coil Tubing and El Toro |
(k) | 318,694 | - | - | 58,797 | - | ||||||||||||||||||
| Other Relationships |
- | - | - | 1,783,185 | 951,546 | |||||||||||||||||||
|
|
|
|
|
|
|
|
|
|
|
|||||||||||||||
| $ | 54,402,890 | $ | 94,889,718 | $ | 171,192,210 | $ | 33,933,501 | $ | 25,643,781 | |||||||||||||||
|
|
|
|
|
|
|
|
|
|
|
|||||||||||||||
F-48
Mammoth Energy Partners LP
NOTES TO CONDENSED CONSOLIDATED FINANCIAL STATEMENTS (unaudited)
| a. | Pressure Pumping provides pressure pumping, stimulation and related completion and rework services to Gulfport, dedicating two spreads and related equipment for the performance of these services. |
| b. | Muskie has agreed to sell and deliver, and Gulfport has agreed to purchase, specified annual and monthly amounts of proppant sand, subject to certain exceptions specified in the agreement, and pay certain costs and expenses. |
| c. | Panther Drilling performs drilling services for Gulfport pursuant to a master service agreement. |
| d. | Energy Services performs completion and production services for Gulfport pursuant to a master service agreement. |
| e. | Sand Tiger provide remote accommodation and food services to Grizzly, an entity owned approximately 75% by affiliates of Wexford and approximately 25% by Gulfport. |
| f. | The contract land and directional drilling segment provides services for El Toro pursuant to a master service agreement. |
| g. | Taylor, an entity under common ownership with the Partnership, has purchased natural sand proppant from Muskie. Natural sand proppant is sold to Taylor at a market-based per ton arrangement on an as-needed basis. |
| h. | Barracuda receives fees from Taylor for the usage of its rail transloading facility. |
| i. | MRI provides iron inspection services to Cementing. |
| j. | White Wing provides rental services to Diamondback. |
| k. | Coil Tubing provides services to El Toro in connection with completion of drilling activities. |
F-49
Mammoth Energy Partners LP
NOTES TO CONDENSED CONSOLIDATED FINANCIAL STATEMENTS (unaudited)
| COST OF REVENUE | ACCOUNTS PAYABLE | |||||||||||||||||||||||
| Six months ended | Year Ended | |||||||||||||||||||||||
| June 30, | December 31, | June 30, | December 31, | |||||||||||||||||||||
| 2016 | 2015 | 2015 | 2016 | 2015 | ||||||||||||||||||||
| Pressure Pumping and Taylor |
(a) | $ | 4,256,832 | $ | 2,591,725 | $ | 2,685,202 | $ | 4,263,350 | $ | 17,552 | |||||||||||||
| Muskie and Taylor |
(a) | 9,516,414 | 12,102,723 | 20,510,977 | 6,888,108 | 6,505,833 | ||||||||||||||||||
| Barracuda and Taylor |
(b) | 97,242 | - | 81,039 | 64,426 | 26,720 | ||||||||||||||||||
| Panther and DBDHT |
(c) | 48,998 | - | 101,206 | - | 48,998 | ||||||||||||||||||
| Bison Trucking and Diamondback |
(d) | 83,958 | 82,616 | 165,951 | - | 12,077 | ||||||||||||||||||
| Energy Services and Elk City Yard |
(e) | 53,400 | 53,400 | 106,800 | - | - | ||||||||||||||||||
| Barracuda and SR Energy |
(f) | 3,728 | - | - | 1,413 | - | ||||||||||||||||||
| Stingray Entities and Taylor |
(g) | - | - | 32,261 | - | 32,261 | ||||||||||||||||||
| Stingray Entities and SR Energy |
(h) | - | 250,994 | 932,896 | 5,943 | 12,208 | ||||||||||||||||||
| Lodging and Dunvegan |
(i) | 2,453 | 64,196 | 71,980 | 178,147 | 304,746 | ||||||||||||||||||
| Bison Trucking and El Toro |
(j) | 5,000 | - | - | - | - | ||||||||||||||||||
|
|
|
|
|
|
|
|
|
|
|
|||||||||||||||
| $ | 14,068,025 | $ | 15,145,654 | $ | 24,688,312 | 11,401,387 | 6,960,395 | |||||||||||||||||
|
|
|
|
|
|
|
|
|
|
|
|||||||||||||||
| SELLING, GENERAL AND ADMINISTRATIVE COSTS |
||||||||||||||||||||||||
| Consolidated and Everest |
(k) | $ | 130,304 | $ | 240,175 | $ | 495,320 | $ | 31,464 | $ | 28,528 | |||||||||||||
| Consolidated and Taylor |
(l) | 73,309 | 130,488 | 287,403 | - | - | ||||||||||||||||||
| Consolidated and Wexford |
(m) | 129,693 | 77,028 | 381,070 | 16,261 | 9,006 | ||||||||||||||||||
| Mammoth and Orange Leaf |
(n) | 53,331 | - | 49,892 | - | - | ||||||||||||||||||
| Pressure Pumping and Caliber |
(o) | - | - | 24,306 | - | - | ||||||||||||||||||
|
|
|
|
|
|
|
|
|
|
|
|||||||||||||||
| $ | 386,637 | $ | 447,691 | $ | 1,237,991 | 47,725 | 37,534 | |||||||||||||||||
|
|
|
|
|
|
|
|
|
|
|
|||||||||||||||
| $ | 11,449,112 | $ | 6,997,929 | |||||||||||||||||||||
|
|
|
|
|
|||||||||||||||||||||
| a. | Taylor has historically sold natural sand proppant to Muskie and Pressure Pumping. Natural sand proppant is sold to Muskie at a market-based per ton arrangement on an as-needed basis to supplement sand provided by its facility (when in operation) if any orders placed by its customers are not able to be readily fulfilled, either because of volume or specific grades of sand requested. |
| b. | From time to time, Barracuda pays for goods and services on behalf of Taylor. |
| c. | Panther rents rotary steerable equipment in connection with its directional drilling services from DBDHT. |
| d. | Bison Trucking leases office space from Diamondback in Midland, Texas. The office space is leased through early 2017. |
| e. | Energy Services leases property from Elk City Yard. |
| f. | From time to time, Barracuda pays for goods and services on behalf of SR Energy. |
| g. | The Stingray Entities utilizes Taylor’s transload facility. |
| h. | Pressure Pumping rents equipment from SR Energy. |
| i. | Dunvegan provides technical and administrative services and pays for goods and services on behalf of Lodging. |
| j. | Bison Trucking leases space for storage of a rig. |
F-50
Mammoth Energy Partners LP
NOTES TO CONDENSED CONSOLIDATED FINANCIAL STATEMENTS (unaudited)
| k. | Everest has historically provided office space and certain technical, administrative and payroll services to the Partnership, and the Partnership has reimbursed Everest in amounts determined by it based on estimates of the amount of office space provided and the amount of employees’ time spent performing services for the Partnership. The reimbursement amounts were determined based upon underlying salary costs of employees performing company-related functions, payroll, revenue or headcount relative to other companies managed by Everest, or specifically identified invoices processed, depending on the nature of the cost. |
| l. | Taylor provides certain administrative and analytical services to the Partnership. |
| m. | Wexford provides certain administrative and analytical services to the Partnership and, from time to time, the Partnership pays for goods and services on behalf of Wexford. |
| n. | Orange Leaf leases office space to Mammoth. |
| o. | Caliber leases office space to Pressure Pumping. |
| 12. | Commitments and Contingencies |
The Partnership leases real estate, rail cars and other equipment under long-term operating leases with varying terms and expiration dates through 2025. Aggregate future minimum lease payments under these non-cancelable operating leases in effect at June 30, 2016 are as follows:
| Year ended December 31: | Amount | |||
| Remainder of 2016 |
$ | 1,923,789 | ||
| 2017 |
2,789,127 | |||
| 2018 |
2,085,284 | |||
| 2019 |
1,664,689 | |||
| 2020 |
1,259,363 | |||
| Thereafter |
4,164,953 | |||
|
|
|
|||
| $ | 13,887,205 | |||
|
|
|
|||
For the six months ended June 30, 2016 and 2015, the Partnership recognized rent expense of $2,001,334 and $2,132,600, respectively.
The Partnership entered into a purchase agreement in 2014 with a sand supplier to begin January 1, 2015 and end December 31, 2016. The Partnership is subject to an annual commitment of 200,000 tons of sand. During June, 2016, the Partnership paid a deposit of $600,000 to the sand supplier to be netted against future purchases of sand under this contract. As of June 30, 2016, the future commitment for 2016 under this agreement is $2,200,000.
An Operating Entity has entered into oral agreements in which certain employees of the Operating Entity would receive bonuses in the event of a sale or initial public offering. The maximum aggregate amount that would be paid by the Operating Entity under these agreements as of June 30, 2016 is $1,800,000 upon a direct or indirect sale of the Operating Entity or $900,000 upon an initial public offering. The Partnership has entered into an agreement in which a certain executive would receive a one-time cash bonus of $300,000 in the event of an initial public offering, and would be entitled to receive annual equity incentive awards equal to a value of 100% of the executives base salary at the time of the agreement, vesting over a four-year period. Based on this executive’s base salary at June 30, 2016, the aggregate fair value of the cash bonus and the initial equity award to which this executive would be entitled in connection with an initial public offering would be $525,000.
F-51
Mammoth Energy Partners LP
NOTES TO CONDENSED CONSOLIDATED FINANCIAL STATEMENTS (unaudited)
The Partnership has various letters of credit totaling $1,930,560 to secure rail car lease payments. These letters of credit were issued under the Partnerships’ revolving credit agreement and are collateralized by substantially all of the assets of the Partnership.
The Partnership partially insures some workers’ compensation and auto claims, which includes medical expenses, lost time and temporary or permanent disability benefits. As of June 30, 2016 and December 31, 2015, the policy requires a $100,000 deductible per occurrence. The Partnership establishes liabilities for the unpaid deductible portion of claims incurred relating to workers’ compensation and auto liability based on estimates. As of June 30, 2016 and December 31, 2015, the policies contained an aggregate stop loss of $1,900,000. As of June 30, 2016 and December 31, 2015, accrued claims were $755,681 and $739,775, respectively. These estimates may change in the near term as actual claims continue to develop. In connection with the insurance programs, letters of credit of $1,176,000 as of June 30, 2016 and December 31, 2015, have been issued supporting the retained risk exposure. As of both June 30, 2016 and December 31, 2015, these letters of credit were collateralized by substantially all of the assets of the Partnership.
The Partnership is routinely involved in state and local tax audits. During the year ended December 31, 2015, the State of Ohio assessed taxes on the purchase of equipment the Partnership believes is exempt under state law. The Partnership has appealed the assessment and has a hearing scheduled for November 30, 2016. While we are not able to predict the outcome of the appeal, this matter is not expected to have a material adverse effect on the financial position or results of operations of the Partnership.
On June 3, 2015, a punitive class and collective action lawsuit alleging that Pressure Pumping failed to pay a class of workers overtime in compliance with the Fair Labor Standards Act and Ohio law was filed titled William Crigler, et al v. Stingray Pressure Pumping, LLC in the U.S. District Court Southern District of Ohio Eastern Division. We are evaluating the background facts and at this time is not able to predict the outcome of this lawsuit or whether it will have a material impact on the Partnership’s financial position, results of operations or cash flows.
On October 12, 2015, a putative class and collective action lawsuit alleging that Energy Services failed to pay a class of workers overtime in compliance with the Fair Labor Standards Act and Oklahoma law was filed titled William Reynolds, individually and on behalf of all others similarly situated v. Redback Energy Services LLC in the U.S. District Court for the Western District of Oklahoma. The Partnership is evaluating the background facts and at this time is not able to predict the outcome of this lawsuit or whether it will have a material impact on the Partnership’s financial position, results of operations or cash flows.
On December 2, 2015, a putative class and collective action lawsuit alleging that Bison Drilling failed to pay a class of workers overtime in compliance with the Fair Labor Standards Act and Texas law was filed titled John Talamentez, individually and on behalf of all others similarly situated v. Bison Drilling and Field Services LLC in the U.S. District Court Western District of Texas Midland/Odessa Division. The Partnership is evaluating the background facts and at this time is not able to predict the outcome of this lawsuit or whether it will have a material impact on the Partnership’s financial position, results of operations or cash flows.
On December 16, 2015, a lawsuit alleging wrongful death was filed titled Cecilia R.G. Uballe and Sabrina Barber, beneficiaries of Esecial D. Uballe, Deceased v. Bison Trucking LLC in the U.S. District Court of Midland Texas. The Partnership is evaluating the background facts and at this time is not able to predict the outcome of this lawsuit or whether it will have a material impact on our financial position, results of operations or cash flows.
On February 12, 2016, a putative lawsuit alleging that Energy Services failed to pay a class of workers in compliance with the Fair Labor Standards Act was filed titled Brian Coniser vs. Redback Energy Services
F-52
Mammoth Energy Partners LP
NOTES TO CONDENSED CONSOLIDATED FINANCIAL STATEMENTS (unaudited)
LLC in the U.S. District Court Southern District of Ohio. The Partnership is evaluating the background facts at this time and are not able to predict the outcome of this lawsuit or whether it will have a material impact on our financial position, results of operations or cash flows.
The Partnership is involved in various other legal proceedings in the ordinary course of business. Although we cannot predict the outcome of these proceedings, legal matters are subject to inherent uncertainties and there exists the possibility that the ultimate resolution of these matters could have a material adverse effect on our business, financial condition, results of operations or cash flows.
| 13. | Operating Segments |
The Partnership is organized into four reportable segments based on the nature of services provided and the basis in which management makes business and operating decisions. The Partnership principally provides oilfield services in connection with on-shore drilling of oil and natural gas wells for small to large domestic independent oil and nature gas producers. The Partnership’s four segments consist of contract land and directional drilling services, completion and production services, completion and production—natural sand proppant and remote accommodation services.
The following table sets forth certain financial information with respect to the Partnership’s reportable segments:
| Completion and Production | ||||||||||||||||||||
| June 30, 2016 |
Contract Land and Directional Drilling Services |
Completion and Production Services |
Natural Sand Proppant |
Remote Accommodation Services |
Total | |||||||||||||||
| Revenue from external customers |
$ | 9,715,833 | $ | 22,517,724 | $ | 2,155,807 | $ | 14,653,537 | $ | 49,042,901 | ||||||||||
| Revenue from related parties |
$ | 1,916,596 | $ | 38,797,702 | $ | 13,688,020 | $ | 572 | $ | 54,402,890 | ||||||||||
| Cost of Revenue |
$ | 12,968,054 | $ | 51,399,808 | $ | 13,456,073 | $ | 6,448,663 | $ | 84,272,598 | ||||||||||
| Selling, general and administrative expenses |
$ | 2,567,237 | $ | 3,079,020 | $ | 1,340,586 | $ | 1,063,952 | $ | 8,050,795 | ||||||||||
| Earnings before interest, impairment, taxes and depreciation and amortization |
$ | (3,902,862 | ) | $ | 6,836,598 | $ | 1,047,168 | $ | 7,141,494 | $ | 11,122,398 | |||||||||
| Other (income) expense |
$ | (57,577 | ) | $ | (649,317 | ) | $ | 4,021 | $ | 8,183 | $ | (694,690 | ) | |||||||
| Interest expense |
1,554,207 | 517,859 | 11,929 | 25,210 | 2,109,205 | |||||||||||||||
| Depreciation and amortization |
$ | 10,945,933 | $ | 21,583,708 | $ | 2,055,547 | $ | 1,082,195 | $ | 35,667,383 | ||||||||||
| Impairment of long-lived assets |
$ | 347,547 | $ | 1,523,338 | $ | - | $ | - | $ | 1,870,885 | ||||||||||
| Income tax provision |
$ | - | $ | (3,094 | ) | $ | - | $ | 1,686,829 | $ | 1,683,735 | |||||||||
| Net income (loss) |
$ | (16,692,972 | ) | $ | (16,135,896 | ) | $ | (1,024,329 | ) | $ | 4,339,077 | $ | (29,514,120 | ) | ||||||
| Total expenditures for property, plant and equipment |
$ | 423,095 | $ | 1,175,371 | $ | 106,252 | $ | 844,240 | $ | 2,548,958 | ||||||||||
| Goodwill |
$ | - | $ | 86,043,148 | $ | - | $ | - | $ | 86,043,148 | ||||||||||
| Intangible assets, net |
$ | - | $ | 26,102,329 | $ | - | $ | - | $ | 26,102,329 | ||||||||||
| Total Assets |
$ | 105,556,115 | $ | 242,505,292 | $ | 30,658,342 | $ | 44,296,405 | $ | 423,016,154 | ||||||||||
F-53
Mammoth Energy Partners LP
NOTES TO CONDENSED CONSOLIDATED FINANCIAL STATEMENTS (unaudited)
| Completion and Production | ||||||||||||||||||||
| June 30, 2015 |
Contract Land and Directional Drilling Services |
Completion and Production Services |
Natural Sand Proppant |
Remote Accommodation Services |
Total | |||||||||||||||
| Revenue from external customers |
$ | 42,183,766 | $ | 51,570,907 | $ | 13,373,845 | $ | 17,917,552 | $ | 125,046,070 | ||||||||||
| Revenue from related parties |
$ | 2,436,339 | $ | 69,930,237 | $ | 21,584,555 | $ | 938,587 | $ | 94,889,718 | ||||||||||
| Cost of Revenue |
$ | 33,367,535 | $ | 93,841,530 | $ | 30,734,783 | $ | 7,919,514 | $ | 165,863,362 | ||||||||||
| Selling, general and administrative expenses |
$ | 3,471,807 | $ | 3,774,822 | $ | 1,527,047 | $ | 1,076,905 | $ | 9,850,581 | ||||||||||
| Earnings before interest, impairment, taxes and depreciation and amortization |
$ | 7,780,763 | $ | 23,884,792 | $ | 2,696,570 | $ | 9,859,720 | $ | 44,221,845 | ||||||||||
| Other (income) expense |
$ | 1,179,455 | $ | 271,146 | $ | 156,137 | $ | 485,747 | $ | 2,092,485 | ||||||||||
| Interest expense |
$ | 1,342,560 | $ | 1,352,425 | $ | 49,117 | $ | 62,228 | $ | 2,806,330 | ||||||||||
| Interest income |
$ | - | $ | - | $ | (97,765 | ) | $ | (477 | ) | $ | (98,242 | ) | |||||||
| Depreciation and amortization |
$ | 12,398,006 | $ | 20,129,723 | $ | 2,110,561 | $ | 1,098,542 | $ | 35,736,832 | ||||||||||
| Impairment of long-lived assets |
$ | 2,565,800 | $ | - | $ | 1,904,981 | $ | - | $ | 4,470,781 | ||||||||||
| Income tax provision |
$ | 25,972 | $ | - | $ | - | $ | 1,547,164 | $ | 1,573,136 | ||||||||||
| Net income (loss) |
$ | (9,731,030 | ) | $ | 2,131,498 | $ | (1,426,461 | ) | $ | 6,666,516 | $ | (2,359,477 | ) | |||||||
| Total expenditures for property, plant and equipment |
$ | 10,470,054 | $ | 8,139,584 | $ | 125,578 | $ | 1,838,831 | $ | 20,574,047 | ||||||||||
| Goodwill |
$ | - | $ | 86,131,395 | $ | - | $ | - | $ | 86,131,395 | ||||||||||
| Intangible assets, net |
$ | - | $ | 35,435,996 | $ | - | $ | - | $ | 35,435,996 | ||||||||||
| Total Assets |
$ | 142,013,448 | $ | 313,108,157 | $ | 40,595,949 | $ | 38,629,731 | $ | 534,347,285 | ||||||||||
The contract land and directional drilling services segment provides vertical, horizontal and directional drilling services. The completion and production services segment provides hydraulic fracturing, pressure control flowback and equipment rental services. The completion and production – natural sand proppant segment sells, distributes and is capable of producing sand for use in hydraulic fracturing. The remote accommodation services segment provides housing, kitchen and dining, and recreational service facilities for oilfield workers that are located in remote areas away from readily available lodging.
The contract land and directional drilling services segment primarily services the Permian Basin in West Texas. The completion and production – services segment primarily services in the Utica Shale of Eastern Ohio and Marcellus Shale in Pennsylvania. The completion and production – natural sand proppant segment primarily services the Utica Shale and Montney Shale in British Columbia and Alberta, Canada. The remote accommodation services segment primarily services Canada.
| 14. | Subsequent Events |
The Partnership has evaluated the period after June 30, 2016 through August 26, 2016, the date the financial statements were available to be issued, noting no subsequent events or transactions that required recognition or disclosure in the financial statements, other than those discussed below.
On August 1, 2016, a putative class and collective action lawsuit alleging that Energy Services failed to pay a class of workers overtime in compliance with the Fair Labor Standards Act and Texas law was filed titled
F-54
Mammoth Energy Partners LP
NOTES TO CONDENSED CONSOLIDATED FINANCIAL STATEMENTS (unaudited)
Michael Caffey, individually and on behalf of all others similarly situated v. Redback Energy Services LLC in the U.S. District Court for the Western District of Texas. The Partnership is evaluating the background facts and at this time is not able to predict the outcome of this lawsuit or whether it will have a material impact on the Partnership’s financial position, results of operations or cash flows.
F-55
| REPORT OF INDEPENDENT CERTIFIED PUBLIC ACCOUNTANTS |
Members
Stingray Pressure Pumping LLC and Affiliate
We have audited the accompanying combined financial statements of Stingray Pressure Pumping LLC and Affiliate (Stingray Logistics LLC) (both Delaware limited liability companies), which comprise the combined balance sheets as of December 31, 2013 and 2012, and the related combined statements of operations, members’ equity, and cash flows for the year ended December 31, 2013 and the period from March 20, 2012 (inception) to December 31, 2012, and the related notes to the financial statements.
Management’s responsibility for the financial statements
Management is responsible for the preparation and fair presentation of these combined financial statements in accordance with accounting principles generally accepted in the United States of America; this includes the design, implementation, and maintenance of internal control relevant to the preparation and fair presentation of combined financial statements that are free from material misstatement, whether due to fraud or error.
Auditor’s responsibility
Our responsibility is to express an opinion on these combined financial statements based on our audits. We conducted our audits in accordance with auditing standards generally accepted in the United States of America. Those standards require that we plan and perform the audit to obtain reasonable assurance about whether the combined financial statements are free from material misstatement.
An audit involves performing procedures to obtain audit evidence about the amounts and disclosures in the combined financial statements. The procedures selected depend on the auditor’s judgment, including the assessment of the risks of material misstatement of the combined financial statements, whether due to fraud or error. In making those risk assessments, the auditor considers internal control relevant to the entity’s preparation and fair presentation of the combined financial statements in order to design audit procedures that are appropriate in the circumstances, but not for the purpose of expressing an opinion on the effectiveness of the entity’s internal control. Accordingly, we express no such opinion. An audit also includes evaluating the appropriateness of accounting policies used and the reasonableness of significant accounting estimates made by management, as well as evaluating the overall presentation of the combined financial statements.
We believe that the audit evidence we have obtained is sufficient and appropriate to provide a basis for our audit opinion.
Opinion
In our opinion, the combined financial statements referred to above present fairly, in all material respects, the financial position of Stingray Pressure Pumping LLC and Affiliate as of December 31, 2013 and 2012, and the results of their operations and their cash flows for the year ended December 31, 2013 and the period from March 20, 2012 (inception) to December 31, 2012 in accordance with accounting principles generally accepted in the United States of America.
/s/ GRANT THORNTON LLP
Oklahoma City, Oklahoma
September 23, 2014
F-56
Stingray Pressure Pumping LLC and Affiliate
COMBINED BALANCE SHEETS
| December 31, | ||||||||
| 2013 | 2012 | |||||||
| Assets |
||||||||
| Current assets |
||||||||
| Cash and cash equivalents |
$ | 16,178,976 | $ | 1,098,405 | ||||
| Accounts receivable |
||||||||
| Related party |
11,029,827 | 5,696,455 | ||||||
| Inventories, net of reserve of $50,000 and $0 |
515,161 | 2,863,873 | ||||||
| Prepaid expenses and other current assets |
1,140,913 | 567,262 | ||||||
|
|
|
|
|
|||||
| Total current assets |
28,864,877 | 10,225,995 | ||||||
| Property and equipment, net |
75,467,523 | 26,948,093 | ||||||
| Other noncurrent assets |
187,373 | — | ||||||
|
|
|
|
|
|||||
| Total assets |
$ | 104,519,773 | $ | 37,174,088 | ||||
|
|
|
|
|
|||||
| Liabilities and Members’ Equity |
||||||||
| Current liabilities |
||||||||
| Accounts payable trade |
$ | 17,563,762 | $ | 4,634,402 | ||||
| Accounts payable—related parties |
3,941,426 | 1,188,084 | ||||||
| Accrued expenses and other current liabilities |
2,290,913 | 1,012,374 | ||||||
| Current maturities of long-term debt |
16,702,602 | 337,979 | ||||||
|
|
|
|
|
|||||
| Total current liabilities |
40,498,703 | 7,172,839 | ||||||
| Long-term debt |
28,207,586 | 1,025,915 | ||||||
|
|
|
|
|
|||||
| Total liabilities |
68,706,289 | 8,198,754 | ||||||
| Commitments and contingencies |
||||||||
| Members’ equity |
35,813,484 | 28,975,334 | ||||||
|
|
|
|
|
|||||
| Total liabilities and members’ equity |
$ | 104,519,773 | $ | 37,174,088 | ||||
|
|
|
|
|
|||||
The accompanying notes are an integral part of these combined financial statements.
F-57
Stingray Pressure Pumping LLC and Affiliate
COMBINED STATEMENTS OF OPERATIONS
| Year ended December 31, 2013 |
March 20, 2012 (inception) to December 31, 2012 |
|||||||
| Revenue—related party |
$ | 82,482,891 | $ | 8,506,191 | ||||
| Costs and expenses |
||||||||
| Cost of services |
57,553,562 | 6,709,852 | ||||||
| Cost of services—related parties |
11,002,824 | 1,147,989 | ||||||
| Selling, general and administrative |
1,148,035 | 544,374 | ||||||
| Selling, general and administrative—related parties |
412,972 | 860,082 | ||||||
| Depreciation |
7,937,518 | 1,237,129 | ||||||
|
|
|
|
|
|||||
| Total costs and expenses |
78,054,911 | 10,499,426 | ||||||
|
|
|
|
|
|||||
| Operating income (loss) |
4,427,980 | (1,993,235 | ) | |||||
| Other income (expense) |
||||||||
| Interest expense |
(1,090,096 | ) | (10,923 | ) | ||||
| Other |
266 | (508 | ) | |||||
|
|
|
|
|
|||||
| (1,089,830 | ) | (11,431 | ) | |||||
|
|
|
|
|
|||||
| Net income (loss) |
$ | 3,338,150 | $ | (2,004,666 | ) | |||
|
|
|
|
|
|||||
The accompanying notes are an integral part of these combined financial statements.
F-58
Stingray Pressure Pumping LLC and Affiliate
COMBINED STATEMENTS OF MEMBERS’ EQUITY
| Balance at March 20, 2012 (inception) |
$ | — | ||
| Members’ contributions |
30,972,712 | |||
| Stock subscriptions receivable |
7,288 | |||
| Net loss |
(2,004,666 | ) | ||
|
|
|
|||
| Balance at December 31, 2012 |
28,975,334 | |||
| Members’ contributions |
3,500,000 | |||
| Net income |
3,338,150 | |||
|
|
|
|||
| Balance at December 31, 2013 |
$ | 35,813,484 | ||
|
|
|
The accompanying notes are an integral part of these combined financial statements.
F-59
Stingray Pressure Pumping LLC and Affiliate
COMBINED STATEMENTS OF CASH FLOWS
| Year ended December 31, 2013 |
March 20, 2012 (inception) to December 31, 2012 |
|||||||
| Cash flows from operating activities |
||||||||
| Net income (loss) |
$ | 3,338,150 | $ | (2,004,666 | ) | |||
| Adjustments to reconcile net income (loss) to net cash provided by (used in) operating activities |
||||||||
| Depreciation |
7,937,518 | 1,237,129 | ||||||
| Amortization of debt issuance costs |
129,630 | — | ||||||
| Gain on disposal of property and equipment |
(265 | ) | — | |||||
| Change in operating assets and liabilities |
||||||||
| Related party receivables |
(5,333,372 | ) | (5,696,455 | ) | ||||
| Inventories |
2,348,712 | (2,863,873 | ) | |||||
| Prepaid expenses and other assets |
(322,374 | ) | (559,974 | ) | ||||
| Accounts payable |
9,912,785 | 4,634,402 | ||||||
| Accounts payable—related parties |
1,024,513 | 1,188,084 | ||||||
| Accrued expenses and other liabilities |
998,698 | 1,012,374 | ||||||
|
|
|
|
|
|||||
| Net cash provided by (used in) operating activities |
20,033,995 | (3,052,979 | ) | |||||
| Cash flows from investing activities |
||||||||
| Purchase of property and equipment |
(50,980,175 | ) | (26,820,674 | ) | ||||
| Cash proceeds from sale of equipment |
35,804 | — | ||||||
|
|
|
|
|
|||||
| Net cash used in investing activities |
(50,944,371 | ) | (26,820,674 | ) | ||||
| Cash flows from financing activities |
||||||||
| Proceeds from debt |
50,000,000 | — | ||||||
| Principal payments on debt |
(6,940,773 | ) | (654 | ) | ||||
| Debt issuance costs |
(575,568 | ) | — | |||||
| Members’ contributions |
3,507,288 | 30,972,712 | ||||||
|
|
|
|
|
|||||
| Net cash provided by financing activities |
45,990,947 | 30,972,058 | ||||||
|
|
|
|
|
|||||
| Net increase in cash and cash equivalents |
15,080,571 | 1,098,405 | ||||||
| Cash and cash equivalents at beginning of period |
1,098,405 | — | ||||||
|
|
|
|
|
|||||
| Cash and cash equivalents at end of period |
$ | 16,178,976 | $ | 1,098,405 | ||||
|
|
|
|
|
|||||
| Supplemental Disclosure of Non-Cash Investing and Financing Activities: |
||||||||
| Seller-financed vehicle acquisitions |
$ | 487,067 | $ | 1,364,548 | ||||
| Fixed assets in accounts payable at period end |
$ | 5,025,245 | $ | — | ||||
| Cash paid for interest, net of capitalized |
$ | 799,856 | $ | 10,923 | ||||
The accompanying notes are an integral part of these combined financial statements.
F-60
Stingray Pressure Pumping LLC and Affiliate
NOTES TO COMBINED FINANCIAL STATEMENTS
Note A – Nature of Operations and Summary of Significant Accounting Policies
Stingray Pressure Pumping LLC (“Pressure Pumping”) was formed March 20, 2012 (“Inception”) as a Delaware limited liability company and is based in Oklahoma. Stingray Logistics LLC (“Logistics”) was formed November 19, 2012 as a Delaware limited liability company and is based in Oklahoma. Both of the entities were formed by Wexford Capital LP (“Wexford”) and Gulfport Energy Corporation (“Gulfport”), are under common control and are referred to collectively as “Stingray” or the “Company”.
Operations
Stingray provides production and completion services and oilfield rentals for oil and natural gas exploration companies. Production and completion services include the hauling of proppant and other goods, cementing in the casing pipe, and hydraulic fracturing and other pressure pumping services. The Company operates primarily within the Utica Shale in Ohio and surrounding areas.
Certain management, administrative and treasury functions were provided by the Company to Stingray Cementing LLC and Stingray Energy Services LLC, both of which are under the common control of Wexford and Gulfport. For purposes of presenting the combined financial statements, allocations were required to determine the cost of general and administrative activities performed by the Company. The allocations were made based upon underlying salary costs of employees performing related functions or specifically identified invoices processed, depending on the nature of the cost. Management believes that the allocation methodology was reasonable; however, the reimbursements of expenses incurred by the Company are not necessarily indicative of the expenses that would have been incurred on a stand-alone basis nor are they indicative of costs that may be incurred in the future.
A summary of significant accounting policies are as follows:
| 1. | Principles of Combination |
The combined financial statements are prepared in accordance with accounting principles generally accepted in the United States of America (“U.S. GAAP). All material accounts and transactions between the entities within the Company have been eliminated in the combined financial statements.
| 2. | Cash and Cash Equivalents |
All highly liquid investments with a maturity of three months or less when acquired are considered cash equivalents. The Company maintains its cash in accounts which may, at times, exceed federally insured limits. At December 31, 2013, the Company had approximately $16,731,000 of its cash and cash equivalents with two financial institutions. The Company had no restricted cash included in its cash or current asset balances at December 31, 2013. The Company has not experienced any losses in these accounts and believes it is not exposed to any significant credit risk.
| 3. | Accounts Receivable |
Accounts receivable include amounts due from customers for services performed and are recorded as the work progresses. The Company grants credit to customers in the ordinary course of business and generally does not require collateral. Most areas in which the Company operates provide for a mechanic’s lien against the property on which the service is performed if the lien is filed within the statutorily specified time frame. Customer balances are generally considered delinquent if unpaid by
F-61
Stingray Pressure Pumping LLC and Affiliate
NOTES TO COMBINED FINANCIAL STATEMENTS
the 30th day following the invoice date and credit privileges may be revoked if balances remain unpaid. At December 31, 2013 and 2012, all of the Company’s accounts receivable are due from a related party (See Note M- Related Party Transactions).
The Company regularly reviews receivables and provides for estimated losses through an allowance for doubtful accounts. In evaluating the level of established reserves, the Company makes judgments regarding its customers’ ability to make required payments, economic events, and other factors. As the financial condition of customers change, circumstances develop, or additional information becomes available, adjustments to the allowance for doubtful accounts may be required. In the event the Company was to determine that a customer may not be able to make required payments, the Company would increase the allowance through a charge to income in the period in which that determination is made. Uncollectible accounts receivable are periodically charged against the allowance for doubtful accounts once final determination is made of their uncollectability.
The Company did not recognize any allowance for doubtful accounts as of December 31, 2013 and December 31, 2012.
| 4. | Inventories |
Inventories are stated at the lower of cost or market, determined on a weighted average cost basis. Inventories consist of consumable supplies. The Company assesses the valuation of its inventories based upon specific usage and future utility. A charge to results of operations is taken when factors that would result in a need for a reduction in the valuation, such as excess or obsolete inventory, are determined. As of December 31, 2013 and 2012 the reserves were $50,000 and $0, respectively.
| 5. | Property and Equipment |
Property and equipment are recorded at cost. Expenditures for major additions and improvements are capitalized while minor replacements, maintenance and repairs, which do not increase the capacity, improve the efficiency or safety, or extend the useful life of such assets, are charged to operations as incurred. Disposals are removed at cost, less accumulated depreciation, and any resulting gain or loss is reflected in operations.
Depreciation is calculated using the straight-line method over the shorter of the estimated useful life, or the remaining lease term, as applicable. The useful lives of the major classes of property and equipment are as follows:
| Buildings |
39 years | |
| Office equipment, furniture and fixtures |
3-5 years | |
| Machinery and equipment |
3-5 years | |
| Vehicles and trailers |
5 years |
| 6. | Long-Lived Assets |
Long-lived assets, primarily property and equipment are reviewed for impairment when events or changes in circumstances indicate that the carrying amount of such assets may not be recoverable. Recoverability of such assets is evaluated by measuring the carrying amount of the assets against the estimated undiscounted future cash flows associated with the assets. If such evaluations indicate that the future undiscounted cash flows from the assets are not sufficient to recover the carrying amount of such assets, the assets are adjusted to their estimated values. There was no impairment recorded for the year ended December 31, 2013 or the period from Inception to December 31, 2012.
F-62
Stingray Pressure Pumping LLC and Affiliate
NOTES TO COMBINED FINANCIAL STATEMENTS
| 7. | Debt Issuance Costs |
The Company capitalizes certain costs in connection with obtaining its borrowings, such as lender’s fees and related attorney’s fees. These costs are charged to interest expense over the contractual term
of the debt using the effective interest method.
| 8. | Revenue Recognition |
The Company recognizes revenue when services are performed, collection of the receivable is probable, persuasive evidence of an arrangement exists, and the price if fixed and determinable. Services are sold without warranty or right of return. Taxes assessed on revenue transactions are presented on a net basis and are not included in revenue.
Pressure Pumping services are typically provided pursuant to a per stage pricing agreement, hourly or spot market basis. Each stage is short-term in nature and is typically completed over the course of or within a few hours of starting the stage. Revenue is recognized upon the completion of each day’s work based upon a completed field ticket. The field ticket includes charges for the mobilization of equipment to location, the services performed, the personnel on the job and any additional equipment used on the job. Additional revenue is generated through the sale of consumable supplies that are incidental to the service being performed. Revenue from consumable supplies is recognized as the consumables are used in the delivery of the overall services. The use of consumable supplies is reflected on completed field tickets.
Logistics generates revenues on a day rate, hourly rate or contracted basis, and revenue is recognized when the services are completed and collectability is reasonably assured.
| 9. | Cost of Services |
The primary components of cost of services are those salaries, consumable supplies, repairs and maintenance and general operational costs that are directly associated with the services performed for the customers. Cost of services – related parties reflects expenses from related parties.
| 10. | Use of Estimates |
The preparation of financial statements in conformity with U.S. GAAP requires management to make estimates and assumptions that affect the reported amounts of assets and liabilities, the disclosure of contingent assets and liabilities at the date of the financial statements and the reported amounts of revenues and expenses during the reporting period. Actual results could differ from those estimates. Significant estimates include but are not limited to the allowance for doubtful accounts, depreciation and amortization of property and equipment and the future cash flows and fair values used to assess recoverability and impairment of long-lived assets.
| 11. | Equity-Based Compensation |
The Company records equity-classified, equity-based payments at fair value on the date of the grant, and expenses the value of the equity-based payments in compensation expenses over the applicable vesting periods.
F-63
Stingray Pressure Pumping LLC and Affiliate
NOTES TO COMBINED FINANCIAL STATEMENTS
| 12. | Income Taxes |
Each of the operating entities comprising the Company are limited liability companies and as such are treated as pass-through entities for income tax purposes. As a pass-through entity, income taxes on net earnings are payable by the members and are not reflected in the financial statements.
As required by Financial Accounting Standards Board (“FASB”) Accounting Standard Codification (“ASC”) 740, Income Taxes, the Company recognizes the financial statement benefit of a tax position only after determining that the relevant tax authority would more likely than not sustain the position following an audit. For tax positions meeting the more-likely-than-not threshold, the amount recognized in the financial statements is the largest benefit that has a greater than 50 percent likelihood of being realized upon ultimate settlement with the relevant tax authority. During the year ended December 31, 2013 and from Inception to December 31, 2012, there were no financial statement benefits or obligations recognized related to uncertain tax positions.
The Company’s accounting policy relating to income tax penalties and interest assessments is to accrue for these costs and record a charge to selling, general and administrative expense for tax penalties and a charge to interest expense for interest assessments during the period the Company has unrecognized tax benefits.
| 13. | Financial Instruments |
The Company’s financial instruments consist primarily of cash and cash equivalents, trade receivables, related party receivables, trade accounts payable, related party payables and long-term debt. The carrying value of cash and cash equivalents, trade receivables, related party receivables, trade payables and related party payables are considered representative of their fair value due to the short term nature of these instruments. The fair value of long-term debt is deemed representative of fair value based on bearing interest rates and having terms comparable to market conditions.
| 14. | Concentrations of Credit Risk and Significant Customers |
Financial instruments that potentially subject the Company to concentrations of credit risk consist of cash and cash equivalents occasionally in excess of federally insured limits and trade receivables. The Company’s accounts receivable have a concentration in the oil and natural gas industry and the customer bases consists primarily of independent oil and natural gas producers.
Sales to one related party customer accounted for 100% of net sales and 75% of accounts receivable at December 31, 2013 and 94% of accounts receivable at December 31, 2012.
| 15. | Concentration of Key Raw Material Suppliers |
Pressure Pumping relies on a limited number of suppliers for sand and chemicals. These key materials are critical for certain of the Company’s operations. The loss of one or more of these suppliers or the limited availability of these materials may negatively impact the Company’s revenues or increase the operating costs.
F-64
Stingray Pressure Pumping LLC and Affiliate
NOTES TO COMBINED FINANCIAL STATEMENTS
| 16. | Environmental Matters |
Estimated remediation costs are accrued using currently available facts, existing environmental permits, technology and enacted laws and regulations. For sites where we are primarily responsible for remediation, our cost estimates are developed based on internal evaluations and are not discounted. Accruals are recorded when it is probable that we will be obligated to pay for environmental sit evaluation, remediation or related activities, and such costs can be reasonably estimated. As additional information becomes available, accruals are adjusted to reflect current cost estimates. Ongoing environmental compliance costs, such as obtaining environmental permits, installation of pollution control equipment and waste disposal are expensed as incurred.
Note B – Inventory
Inventory consists of the following as of December 31:
| 2013 | 2012 | |||||||
| Proppant |
$ | 55,900 | $ | 2,863,873 | ||||
| Chemicals |
459,261 | — | ||||||
|
|
|
|
|
|||||
| $ | 515,161 | $ | 2,863,873 | |||||
|
|
|
|
|
|||||
Note C – Prepaid and Other Current Assets
Prepaid and other current assets consists of the following as of December 31:
| 2013 | 2012 | |||||||
| Prepaid Expenses |
$ | 48,562 | $ | 43,723 | ||||
| Prepaid Insurance |
820,687 | 514,753 | ||||||
| Debt Issuance Costs |
271,664 | — | ||||||
| Other |
— | 8,786 | ||||||
|
|
|
|
|
|||||
| $ | 1,140,913 | $ | 567,262 | |||||
|
|
|
|
|
|||||
Note D – Property and Equipment
Net property and equipment consists of the following as of December 31:
| 2013 | 2012 | |||||||
| Buildings |
$ | 1,094,583 | $ | 460,213 | ||||
| Office equipment, furniture and fixtures |
302,309 | 29,928 | ||||||
| Machinery and equipment |
59,887,982 | 27,004,030 | ||||||
| Vehicles and trailers |
3,984,695 | 447,158 | ||||||
|
|
|
|
|
|||||
| 65,269,569 | 27,941,329 | |||||||
| Less accumulated depreciation and amortization |
(9,170,699 | ) | (1,237,129 | ) | ||||
|
|
|
|
|
|||||
| 56,098,870 | 26,704,200 | |||||||
| Deposits on equipment and equipment in process of assembly |
18,550,159 | 89,920 | ||||||
| Land |
818,494 | 153,973 | ||||||
|
|
|
|
|
|||||
| $ | 75,467,523 | $ | 26,948,093 | |||||
|
|
|
|
|
|||||
F-65
Stingray Pressure Pumping LLC and Affiliate
NOTES TO COMBINED FINANCIAL STATEMENTS
Deposits on equipment and equipment in process of assembly represents deposits placed with vendors for equipment that is in the process of assembly and purchased equipment that is being outfitted for its intended use. The equipment is not depreciated until it has been placed in service.
Depreciation expense charged to operations totaled $7,937,518 and $1,237,129 for the year ended December 31, 2013 and the period from Inception to December 31, 2012, respectively.
Capitalized interest totaled $147,755 for the year ended December 31, 2013. There was no interest capitalized from Inception to December 31, 2012.
Note E – Other Non-current Assets
Other non-current assets consist of the following as of December 31:
| 2013 | 2012 | |||||||
| Debt Issuance Costs |
$ | 174,273 | $ | — | ||||
| Deposits |
13,100 | — | ||||||
|
|
|
|
|
|||||
| $ | 187,373 | $ | — | |||||
|
|
|
|
|
|||||
Note F – Accrued and Other Current Liabilities
Accrued and other current liabilities consisted of the following as of December 31:
| 2013 | 2012 | |||||||
| Insurance |
$ | 970,283 | $ | 399,484 | ||||
| Materials |
— | 114,303 | ||||||
| Repairs/Maintenance |
— | 48,482 | ||||||
| Freight |
— | 103,145 | ||||||
| Payroll |
941,020 | 110,000 | ||||||
| Fuel |
— | 202,920 | ||||||
| Interest |
160,610 | — | ||||||
| Commercial Activity Taxes |
219,000 | — | ||||||
| Other |
— | 34,040 | ||||||
|
|
|
|
|
|||||
| $ | 2,290,913 | $ | 1,012,374 | |||||
|
|
|
|
|
|||||
Note G – Long-Term Debt
Long-term debt consists of the following as of December 31:
| 2013 | 2012 | |||||||
| Term loans |
$ | 43,424,096 | $ | — | ||||
| Vehicle loans |
1,486,092 | 1,363,894 | ||||||
|
|
|
|
|
|||||
| 44,910,188 | 1,363,894 | |||||||
| Less current portion |
16,702,602 | 337,979 | ||||||
|
|
|
|
|
|||||
| Total |
$ | 28,207,586 | $ | 1,025,915 | ||||
|
|
|
|
|
|||||
F-66
Stingray Pressure Pumping LLC and Affiliate
NOTES TO COMBINED FINANCIAL STATEMENTS
On July 3, 2013, the Company entered into a $50,000,000 term loan with a third party lender. The loan subjects the Company to certain financial reporting requirements and financial covenants. The loan requires maintenance of a minimum tangible net worth of $30,000,000. The loan also requires that debt to tangible net worth not to exceed 1.75 to 1.00. The loan is secured by certain specified equipment. The loan matures over 36 months and requires a monthly payments of principal and interest. As of December 31, 2013, the monthly payments were $1,488,000. The maturity date is August 1, 2016. The loans bears interest at the rate of New York Prime Rate plus 0.75% and is subject to a floor of 4.50%. The outstanding balance at December 31, 2013 was $43,424,096. The interest rate at December 31, 2013 was 4.50%. The Company was in compliance with the financial covenants at December 31, 2013.
On various dates between November 26, 2012 and October 25, 2013, the Company entered into borrowing agreements to finance the purchase of certain vehicles and trailers. The agreements are secured by certain specified vehicles. The cost of the vehicles and trailers serving as collateral for the borrowing agreements was $3,224,465 at December 31, 2013. The loan agreements are for 48 months and require monthly payments of principal and interest. As of December 31, 2013, the monthly payments were $43,312. The outstanding balance at December 31, 2013 and December 31, 2012 was $1,486,092 and $1,363,894, respectively. The interest rates on the loans are fixed and range from 5.25% to 5.99%.
At December 31, 2013, the aggregate maturities of long-term debt are as follows:
| 2014 |
$ | 16,702,602 | ||
| 2015 |
17,465,560 | |||
| 2016 |
10,642,762 | |||
| 2017 |
— | |||
| 2018 |
99,264 | |||
|
|
|
|||
| Total |
$ | 44,910,188 | ||
|
|
|
The Company incurs loan origination fees that are initially capitalized and are included in “other current assets” and “other noncurrent assets” in the combined balance sheets. The balance of unamortized origination fees were $445,937 and $0 as of December 31, 2013 and 2012, respectively. These costs are amortized as a charge to interest expense using the effective interest method. The Company recorded amortization of $129,630 and $0 for the year ended December 31, 2013 and the period ended December 31, 2012, respectively.
Note I – Operating Leases
The Company has committed to various housing, facility and equipment leases some of which have renewal and purchase options. The lease terms vary from one to six months.
Rent expense for the year ended December 31, 2013 and the period from Inception to December 31, 2012 was $432,052 and $223,976, respectively. For the year ended December 31, 2013, $369,641 was included in Cost of Services and $62,411 was included in Selling, General and Administrative activities on the Combined Statements of Operations. From inception to December 31, 2012, $214,400 was included in Cost of Services and $9,576 was included in Selling, General and Administrative activities on the Combined Statements of Operations.
Note J – Members’ Equity
Each of Pressure Pumping and Logistics operates under a limited liability company agreement (the “Agreement”) and will continue perpetually until terminated pursuant to statute or any provision of the Agreements. No member shall be liable for the expenses, liabilities or obligations of the Company.
F-67
Stingray Pressure Pumping LLC and Affiliate
NOTES TO COMBINED FINANCIAL STATEMENTS
Each Agreement provides for specific voting rights of the members. For matters that require vote, members shall have one vote for each whole percentage interest held by the member at the time of vote.
Distributions and profit and loss allocations are based on the pro rata share of each member’s ownership percentages.
Each Agreement places limits on the transfer of members’ interests. Encumbrances are prohibited unless they are a Permitted Encumbrance, as defined in the Agreement.
Note K – Commitments and Contingencies
The Company is, from time to time, involved in routine litigation or subject to disputes or claims related to business activities, including workers’ compensation claims and employment related disputes. In the opinion of management, none of the pending litigation, disputes or claims against the Company, if decided adversely, is expected to have a material effect on the Company’s financial condition, results of operations, or cash flows.
The Company has entered into contracts with a certain key employee that in the event of either an initial public offering (“IPO”) or sale of substantially all of the assets of the Company to a third party buyer this employee would receive a cash payment in the amount of 1% of the difference between the net proceeds from a sale of the Company and the total investment in the Company of its owners or a stock grant in the event of an IPO. The amount of any grant of stock would be determined by the Company’s approved stock plan.
The Company has firm purchase commitments for equipment of approximately $2,218,338 as of December 31, 2013.
Note L – Equity-Based Compensation
Upon formation of each Stingray entity, specified members of management were granted the right to receive capital distributions under the various Agreements, after each contributing member’s unreturned capital balance is reduced to zero – referred to as “Pay-out”. The specified member’s right to receive a post Pay-out distribution is generally subject to continued employment. The Company has valued the post Pay-out distribution rights using the option pricing method as of the grant dates that coincide with the formation of the respective entities. The exercise price was based on the contributing members’ contributions at the formation date. No dividend yield was included because the Company does not plan to pay dividends. For Pressure Pumping, valuation assumptions included a risk free interest rate of 0.95%, expected life of four years, and an expected volatility of 49.39%. For Logistics, valuation assumptions included a risk free interest rate of 0.47%, an expected life of four years, and an expected volatility of 45.91%. No compensation cost has been recognized during the year ended December 31, 2013 and from Inception through December 31, 2012, because Pay-out was not deemed probable, and the post Pay-out right does not vest until Pay-out is reached. At December 31, 2013, the Company had $1,579,051 in unrecognized compensation costs associated with these post Pay-out distribution rights.
Note M – Related Party Transactions
The Company provides certain services to Gulfport Energy Corporation, a member of the Company (“Gulfport”). For the year ended December 31, 2013, all of the Company’s revenues were generated through transactions with Gulfport. During the period from Inception through December 31, 2012, all of the Company’s revenues were generated through transactions with Gulfport. Accounts receivable from Gulfport as of December 31, 2013 and 2012 were $8,237,652 and $5,329,426, respectively.
F-68
Stingray Pressure Pumping LLC and Affiliate
NOTES TO COMBINED FINANCIAL STATEMENTS
Gulfport also provided administrative and payroll services to the Company under a shared services agreement. These amounts totaled $411,207 during 2013 and $1,786,326 from Inception through December 31, 2012. During the year ended December 31, 2013, the entire amount was for selling, general and administrative activities. From Inception to December 31, 2012, $926,244 was for cost of services revenue activities and $860,082 was for selling, general and administrative activities. As of December 31, 2013 and 2012, the Company owed Gulfport $0 and $928,020, respectively.
The Company purchases sand used in its hydraulic fracturing operations from an affiliate. During the year ended December 31, 2013, the Company purchased $9,266,078 in sand and the entire amount is included in cost of services revenue activities. As of December 31, 2013, related party accounts payable included $1,576,199 payable to the affiliate.
The Company rented certain equipment used in its hydraulic fracturing operations from an affiliate. During the year ended December 31, 2013, the Company rented $65,410 in equipment from the affiliate and the entire amount is included in cost of services revenue activities. As of December 31, 2013, related party accounts payable included $65,410 payable to the affiliate.
The Company also rented certain equipment used in its hydraulic fracturing operations from an affiliate. During the year ended December 31, 2013 and from Inception to December 31, 2012, the Company rented $113,483 and $0, respectively, in equipment from the affiliate and the entire amount is included in cost of services revenue activities. As of December 31, 2013 and 2012, related party accounts payable included $113,483 and $0, respectively, payable to the affiliate.
The Company also provides certain management, administrative and treasury functions to an affiliate. During the year ended December 31, 2013 and from Inception to December 31, 2012, the Company paid $107,487 and $0, respectively, of payroll expenses related to these services which were passed through to the affiliate. The Company also pays certain other costs on behalf of the affiliate which are passed through to the affiliate. At December 31, 2013 and 2012, accounts receivable due from the affiliate were $1,789,434 and $0, respectively.
In November of 2012, certain equipment was purchased for the Company and paid for by an affiliate resulting in an $89,920 payable to the affiliate at December 31, 2013 and 2012.
The Company also provides certain management, administrative and treasury functions to an affiliate. During the years ended December 31, 2013 and 2012, the Company paid $169,528 and $257,327, respectively, of payroll expenses related to these services which were passed through to the affiliate. The Company also pays certain other costs on behalf of the affiliate which are passed through to the affiliate. At December 31, 2013 and 2012, accounts receivable due from the affiliate were $1,002,741 and $367,029, respectively.
The Company purchases equipment and contracts for repairs and maintenance on equipment from an affiliate. During the year ended December 31, 2013 and for the period from Inception through December 31, 2012, the Company purchased equipment, including deposits for equipment not yet delivered of $10,298,205 and $0, respectively. The Company also contracted for repairs and maintenance services during the year ended December 31, 2013 of $1,666,229. As of December 31, 2013 and 2012, related party accounts payable included $2,091,122 and $170,144, respectively.
The Company receives some administrative services from certain affiliates. These amounts totaled $2,115 during 2013. Of this amount, $350 was for cost of services revenue activities and $1,765 was for selling, general and administrative activities. As of December 31, 2013, related party accounts payable included $5,292.
F-69
Stingray Pressure Pumping LLC and Affiliate
NOTES TO COMBINED FINANCIAL STATEMENTS
Note N – 401(k) Plans
The Company provides a 401(k) retirement plan that enables workers to defer up to specific percentages of their annual compensation and contribute such amount to the plan. The Company provides a contribution of 3% for each employee and could also contribute additional amounts at their sole discretion. For the year ended December 31, 2013 and the period from Inception to December 31, 2012, the contributions were $252,633 and $92,629, respectively.
Note O – Subsequent Events
The Company has evaluated events and transactions that occurred subsequent to December 31, 2013 through September 23, 2014, the date these financials were available to be issued, noting no subsequent events or transactions that required recognition or disclosure in the financial statements, other than noted below.
On January 16, 2014, the Company paid down all outstanding principal and interest of $489,217 on the term loan dated July 17, 2013 using a portion of the proceeds from the term loan dated December 4, 2013.
F-70
STINGRAY PRESSURE PUMPING LLC AND AFFILIATE
CONDENSED COMBINED BALANCE SHEETS (unaudited)
| September 30, 2014 |
December 31, 2013 |
|||||||
| Assets |
||||||||
| Current assets |
||||||||
| Cash and cash equivalents |
$ | 27,354,182 | $ | 16,178,976 | ||||
| Accounts receivable |
||||||||
| Trade |
7,631,698 | - | ||||||
| Related party |
9,321,787 | 10,826,424 | ||||||
| Inventory, net |
1,656,844 | 515,161 | ||||||
| Prepaid expenses and other current assets |
1,521,207 | 1,140,913 | ||||||
|
|
|
|
|
|||||
| Total current assets |
47,485,718 | 28,661,474 | ||||||
| Property and equipment, net |
74,047,548 | 75,467,523 | ||||||
| Other noncurrent assets |
1,215,750 | 187,373 | ||||||
|
|
|
|
|
|||||
| Total assets |
$ | 122,749,016 | $ | 104,316,370 | ||||
|
|
|
|
|
|||||
| Liabilities and Members’ Equity |
||||||||
| Current liabilities |
||||||||
| Accounts payable trade |
$ | 18,565,677 | $ | 17,563,762 | ||||
| Accounts payable - related parties |
7,803,937 | 3,738,023 | ||||||
| Accrued expenses and other current liabilities |
2,564,376 | 2,290,913 | ||||||
| Current maturities of long-term debt |
15,067,432 | 16,702,602 | ||||||
|
|
|
|
|
|||||
| Total current liabilities |
44,001,422 | 40,295,300 | ||||||
| Long-term debt |
36,086,694 | 28,207,586 | ||||||
|
|
|
|
|
|||||
| Total liabilities |
80,088,116 | 68,502,886 | ||||||
| Commitments and contingencies (Note 7) |
||||||||
| Members’ equity |
42,660,900 | 35,813,484 | ||||||
|
|
|
|
|
|||||
| Total liabilities and members’ equity |
$ | 122,749,016 | $ | 104,316,370 | ||||
|
|
|
|
|
|||||
The accompanying notes are an integral part of these condensed combined financial statements.
F-71
STINGRAY PRESSURE PUMPING LLC AND AFFILIATE
CONDENSED COMBINED STATEMENTS OF OPERATIONS (unaudited)
| Nine months ended September 30, | ||||||||
| 2014 | 2013 | |||||||
| Revenue - related parties |
$ | 85,605,182 | $ | 55,788,653 | ||||
| Revenue |
20,708,764 | - | ||||||
|
|
|
|
|
|||||
| 106,313,946 | 55,788,653 | |||||||
|
|
|
|
|
|||||
| Costs and expenses |
||||||||
| Cost of services |
81,981,565 | 35,524,498 | ||||||
| Cost of services - related parties |
6,534,149 | 8,685,336 | ||||||
| Selling, general and administrative |
1,998,066 | 597,021 | ||||||
| Selling, general and administrative - related parties |
62,559 | 348,436 | ||||||
| Depreciation |
12,645,153 | 5,021,949 | ||||||
|
|
|
|
|
|||||
| Total costs and expenses |
103,221,492 | 50,177,240 | ||||||
|
|
|
|
|
|||||
| Operating income |
3,092,454 | 5,611,413 | ||||||
| Other income (expense) |
||||||||
| Interest expense |
(1,291,063) | (426,608) | ||||||
| Other |
46,025 | (17,645) | ||||||
|
|
|
|
|
|||||
| (1,245,038) | (444,253) | |||||||
|
|
|
|
|
|||||
| Net income |
$ | 1,847,416 | $ | 5,167,160 | ||||
|
|
|
|
|
|||||
The accompanying notes are an integral part of these condensed combined financial statements
F-72
STINGRAY PRESSURE PUMPING LLC AND AFFILIATE
CONDENSED COMBINED STATEMENT OF MEMBERS’ EQUITY (unaudited)
| Balance at December 31, 2013 |
$ | 35,813,484 | ||
| Members’ contributions |
5,000,000 | |||
| Net income |
1,847,416 | |||
|
|
|
|||
| Balance at September 30, 2014 |
$ | 42,660,900 | ||
|
|
|
The accompanying notes are an integral part of these condensed combined financial statements.
F-73
STINGRAY PRESSURE PUMPING LLC AND AFFILIATE
CONDENSED COMBINED STATEMENTS OF CASH FLOWS (unaudited)
| Nine months ended September 30, | ||||||||
| 2014 | 2013 | |||||||
| Cash flows from operating activities |
||||||||
| Net income |
$ | 1,847,416 | $ | 5,167,160 | ||||
| Adjustments to reconcile net income to net cash provided by operating activities |
||||||||
| Depreciation |
12,645,153 | 5,021,949 | ||||||
| Amortization of debt issuance costs |
223,249 | 58,391 | ||||||
| Gain on disposal of property and equipment |
(30,948) | (1,582) | ||||||
| Change in operating assets and liabilities |
||||||||
| Trade receivables |
(7,631,698) | (2,547) | ||||||
| Related party receivables |
1,504,637 | (8,519,329) | ||||||
| Inventories |
(1,141,683) | 2,650,033 | ||||||
| Prepaid expenses and other assets |
(459,588) | 357,304 | ||||||
| Accounts payable |
4,018,490 | 4,272,175 | ||||||
| Accounts payable - related parties |
5,251,311 | 2,912,919 | ||||||
| Accrued expenses and other liabilities |
134,464 | (213,270) | ||||||
|
|
|
|
|
|||||
| Net cash provided by operating activities |
16,360,803 | 11,703,203 | ||||||
| Cash flows from investing activities |
||||||||
| Purchase of property and equipment |
(16,379,475) | (33,935,895) | ||||||
| Cash proceeds from sale of equipment |
160,000 | 35,804 | ||||||
|
|
|
|
|
|||||
| Net cash used in investing activities |
(16,219,475) | (33,900,091) | ||||||
| Cash flows from financing activities |
||||||||
| Proceeds from debt |
18,699,518 | 50,000,000 | ||||||
| Principal payments on debt |
(12,455,580) | (2,881,358) | ||||||
| Debt issuance costs |
(210,060) | (575,568) | ||||||
| Members’ contributions |
5,000,000 | 3,507,288 | ||||||
|
|
|
|
|
|||||
| Net cash provided by financing activities |
11,033,878 | 50,050,362 | ||||||
|
|
|
|
|
|||||
| Net increase in cash and cash equivalents |
11,175,206 | 27,853,474 | ||||||
| Cash and cash equivalents at beginning of period |
16,178,976 | 1,098,405 | ||||||
|
|
|
|
|
|||||
| Cash and cash equivalents at end of period |
$ | 27,354,182 | $ | 28,951,879 | ||||
|
|
|
|
|
|||||
| Supplemental Disclosure of Non-Cash Investing and Financing Activities: |
||||||||
| Seller-financed vehicle acquisitions |
$ | - | $ | 650 | ||||
| Fixed assets in accounts payable at period end |
$ | - | $ | 1,011,280 | ||||
| Cash paid for interest, net of capitalized interest |
$ | 1,228,423 | $ | 368,216 | ||||
The accompanying notes are an integral part of these condensed combined financial statements.
F-74
Stingray Pressure Pumping LLC and Affiliate
NOTES TO THE CONDENSED COMBINED FINANCIAL STATEMENTS
(Unaudited)
| 1. | Organization and Basis of Presentation |
Stingray Pressure Pumping LLC (“Pressure Pumping”) was formed March 20, 2012 (“Inception”) as a Delaware limited liability company and is based in Oklahoma. Stingray Logistics LLC (“Logistics”) was formed November 19, 2012 as a Delaware limited liability company and is based in Oklahoma. Both of the entities were formed by Wexford Capital LP (“Wexford”) and Gulfport Energy Corporation (“Gulfport”), are under common control and are referred to collectively as “Stingray” or the “Company”.
Operations
Stingray provides production and completion services for oil and natural gas exploration companies. Production and completion services include the hauling of proppant and other goods and hydraulic fracturing and other pressure pumping services. The Company operates primarily within the Utica Shale in Ohio and surrounding areas. Certain management, administrative, and treasury functions were provided by the Company to Stingray Cementing LLC and Stingray Energy Services LLC, both of which are under the common control of Wexford Capital LP and Gulfport Energy Corporation.
For purposes of presenting the condensed combined financial statements, allocations were required to determine the cost of general and administrative activities performed by the Company. The allocations were made based upon underlying salary costs of employees performing related functions or specifically identified invoices processed, depending on the nature of the cost. Management believes that the allocation methodology was reasonable; however, the reimbursements of expenses incurred by the Company are not necessarily indicative of the expenses that would have been incurred on a stand-alone basis nor are they indicative of costs that may be incurred in the future.
A summary of significant accounting policies are as follows:
| 2. | Principles of Combination |
The accompanying condensed combined financial statements include the accounts of Stingray Pressure Pumping LLC and Stingray Logistics LLC. All significant intercompany transactions and balances have been eliminated.
These unaudited condensed combined financial statements should be read in conjunction with the audited combined financial statements for the year ended December 31, 2013. In the opinion of management, the statements reflect all adjustments necessary for a fair presentation of the results of interim periods. Certain information and note disclosures normally included in financial statements prepared in accordance with accounting principles general accepted in the United State of America, which are not required for interim purposes, have been condensed or omitted. These financial statements reflect all adjustments, consisting only of normal, recurring adjustments that, in the opinion of the Company’s management, are necessary for a fair presentation of the financial position, results of operations and cash flows for the periods presented. Operating results for the nine month period ended September 30, 2014 are not necessarily indicative of the results that may be expected for any subsequent quarter or for the year ending December 31, 2014
a. Cash and Cash Equivalents
All highly liquid investments with an original maturity of three months or less are considered cash equivalents. The Company maintains its cash in accounts which may, at times, exceed federally insured
F-75
Stingray Pressure Pumping LLC and Affiliate
NOTES TO THE CONDENSED COMBINED FINANCIAL STATEMENTS
(Unaudited)
limits. At September 30, 2014 and December 31, 2013, the Company had approximately $28,268,439 and $16,731,000, respectively, of its cash and cash equivalents with two financial institutions. The Company had $17,000,000 restricted cash included in its cash or current asset balances at September 30, 2014. The Company has not experienced any losses in these accounts and believes it is not exposed to any significant credit risk.
b. Accounts Receivable
Accounts receivable include amounts due from customers for services performed and are recorded as the work progresses. The Company grants credit to customers in the ordinary course of business and generally does not require collateral. Most areas in which the Company operates provide for a mechanic’s lien against the property on which the service is performed if the lien is filed within the statutorily specified time frame. Customer balances are generally considered delinquent if unpaid by the 30th day following the invoice date and credit privileges may be revoked if balances remain unpaid. At December 31, 2013, substantially all of the Company’s accounts receivable are due from a related party (See Note 9—Related Party Transactions).
The Company regularly reviews receivables and provides for estimated losses through an allowance for doubtful accounts. In evaluating the level of established reserves, the Company makes judgments regarding its customers’ ability to make required payments, economic events, and other factors. As the financial condition of customers change, circumstances develop, or additional information becomes available, adjustments to the allowance for doubtful accounts may be required. In the event the Company was to determine that a customer may not be able to make required payments, the Company would increase the allowance through a charge to income in the period in which that determination is made. Uncollectible accounts receivable are periodically charged against the allowance for doubtful accounts once final determination is made of their uncollectability.
The Company did not recognize any allowance for doubtful accounts as of September 30, 2014 and December 31, 2013.
c. Inventories
Inventories are stated at the lower of cost or market, determined on a weighted average cost basis. Inventories consist of consumable supplies. The Company assesses the valuation of its inventories based upon specific usage and future utility. A charge to results of operations is taken when factors that would result in a need for a reduction in the valuation, such as excess or obsolete inventory, are determined. As of September 30, 2014 and December 31, 2013, the reserve was $50,000.
d. Property and Equipment
Property and equipment are recorded at cost. Expenditures for major additions and improvements are capitalized while minor replacements, maintenance and repairs, which do not increase the capacity, improve the efficiency or safety, or extend the useful life of such assets, are charged to operations as incurred. Disposals are removed at cost, less accumulated depreciation, and any resulting gain or loss is reflected in operations.
Depreciation is calculated using the straight-line method over the shorter of the estimated useful life, or the remaining lease term, as applicable.
F-76
Stingray Pressure Pumping LLC and Affiliate
NOTES TO THE CONDENSED COMBINED FINANCIAL STATEMENTS
(Unaudited)
The useful lives of the major classes of property and equipment are as follows:
| Buildings |
39 years | |
| Office equipment, furniture and fixtures |
3-5 years | |
| Machinery and equipment |
3-5 years | |
| Vehicles and trailers |
5 years |
e. Long-Lived Assets
Long-lived assets, primarily property and equipment are reviewed for impairment when events or changes in circumstances indicate that the carrying amount of such assets may not be recoverable. Recoverability of such assets is evaluated by measuring the carrying amount of the assets against the estimated undiscounted future cash flows associated with the assets. If such evaluations indicate that the future undiscounted cash flows from the assets are not sufficient to recover the carrying amount of such assets, the assets are adjusted to their estimated values. There was no impairment recorded for the periods ended September 30, 2014 or September 30, 2013.
f. Debt Issuance Costs
The Company capitalizes certain costs in connection with obtaining its borrowings, such as lender’s fees and related attorney’s fees. These costs are charged to interest expense over the contractual term of the debt using the effective interest method.
g. Revenue Recognition
The Company recognizes revenue when services are performed, collection of the receivable is probable, persuasive evidence of an arrangement exists, and the price is fixed and determinable. Services are sold without warranty or right of return. Taxes assessed on revenue transactions are presented on a net basis and are not included in revenue.
Pressure Pumping services are typically provided pursuant to a per stage pricing agreement, hourly or spot market basis. Each stage is short-term in nature and is typically completed over the course of or within a few hours of starting the stage. Revenue is recognized upon the completion of each day’s work based upon a completed field ticket. The field ticket includes charges for the mobilization of equipment to location, the services performed, the personnel on the job and any additional equipment used on the job. Additional revenue is generated through the sale of consumable supplies that are incidental to the service being performed. Revenue from consumable supplies is recognized as the consumables are used in the delivery of the overall services. The use of consumable supplies is reflected on completed field tickets. Consumable supplies are also sold directly to the customer. These sales are not necessarily tied to the pressure pumping services being performed. Revenue related to these sales is recognized upon delivery of the consumables.
Logistics generates revenues on a day rate, hourly rate or contracted basis, and revenue is recognized when the services are completed and collectability is reasonably assured.
h. Cost of Services
The primary components of cost of services are those salaries, consumable supplies, repairs and maintenance and general operational costs that are directly associated with the services performed for the customers. Cost of services—related parties reflects expenses from related parties.
F-77
Stingray Pressure Pumping LLC and Affiliate
NOTES TO THE CONDENSED COMBINED FINANCIAL STATEMENTS
(Unaudited)
i. Use of Estimates
The preparation of financial statements in conformity with U.S. GAAP requires management to make estimates and assumptions that affect the reported amounts of assets and liabilities, the disclosure of contingent assets and liabilities at the date of the financial statements and the reported amounts of revenues and expenses during the reporting period. Actual results could differ from those estimates.
Significant estimates include but are not limited to the allowance for doubtful accounts, inventory valuation allowance, depreciation and amortization of property and equipment and the future cash flows and fair values used to assess recoverability and impairment of long-lived assets.
j. Equity-Based Compensation
The Company records equity-classified, equity-based payments at fair value on the date of the grant, and expenses the value of the equity-based payments in compensation expenses over the applicable vesting periods.
k. Income Taxes
Each of the operating entities comprising the Company are limited liability companies and as such are treated as pass-through entities for income tax purposes. As a pass-through entity, income taxes on net earnings are payable by the members and are not reflected in the financial statements.
As required by Financial Accounting Standards Board (“FASB”) Accounting Standard Codification (“ASC”) 740, Income Taxes, the Company recognizes the financial statement benefit of a tax position only after determining that the relevant tax authority would more likely than not sustain the position following an audit. For tax positions meeting the more-likely-than-not threshold, the amount recognized in the financial statements is the largest benefit that has a greater than 50 percent likelihood of being realized upon ultimate settlement with the relevant tax authority. During the periods ended September 30, 2014 and September 30, 2013, there were no financial statement benefits or obligations recognized related to uncertain tax positions.
The Company’s accounting policy relating to income tax penalties and interest assessments is to accrue for these costs and record a charge to selling, general and administrative expense for tax penalties and a charge to interest expense for interest assessments during the period the Company has unrecognized tax benefits. The pass-through entities are not subject to tax examinations by tax authorities for years before 2012.
l. Financial Instruments
The Company’s financial instruments consist primarily of cash and cash equivalents, trade receivables, related party receivables, trade accounts payable, related party payables and long-term debt. The carrying value of cash and cash equivalents, trade receivables, related party receivables, trade accounts payable and related party payables are considered representative of their fair value due to the short term nature of these instruments. The fair value of long-term debt is deemed representative of fair value based on bearing interest rates and having terms comparable to market conditions.
m. Concentrations of Credit Risk and Significant Customers
Financial instruments that potentially subject the Company to concentrations of credit risk consist of cash and cash equivalents occasionally in excess of federally insured limits and trade receivables. The
F-78
Stingray Pressure Pumping LLC and Affiliate
NOTES TO THE CONDENSED COMBINED FINANCIAL STATEMENTS
(Unaudited)
Company’s accounts receivable have a concentration in the oil and natural gas industry and the customer bases consists primarily of independent oil and natural gas producers.
Sales to one related party customer accounted for 80% and 100% of net sales for the periods ended September 30, 2014 and September 30, 2013, respectively, and approximately 55% and 100% of accounts receivable at September 30, 2014 and December 31, 2013, respectively.
n. Concentration of Key Material Suppliers
Pressure Pumping relies on a limited number of suppliers for sand and chemicals. These key materials are critical for certain of the Company’s operations. The loss of one or more of these suppliers or the limited availability of these materials may negatively impact the Company’s revenues or increase the operating costs.
| 3. | Inventory |
Inventory consists of the following as of:
| September 30, 2014 |
December 31, 2013 |
|||||||
| Proppant |
$ | 539,769 | $ | 55,900 | ||||
| Chemicals, net of reserve of $50,000 and $50,000, respectively |
872,359 | 459,261 | ||||||
| Supplies |
244,716 | - | ||||||
|
|
|
|
|
|||||
| $ | 1,656,844 | $ | 515,161 | |||||
|
|
|
|
|
|||||
| 4. | Property and Equipment |
Net property and equipment consists of the following as:
| September 30, 2014 |
December 31, 2013 |
|||||||
| Buildings |
$ | 1,094,583 | $ | 1,094,583 | ||||
| Office equipment, furniture and fixtures |
463,551 | 302,309 | ||||||
| Machinery and equipment |
87,133,159 | 59,887,982 | ||||||
| Vehicles and trailers |
4,451,003 | 3,984,695 | ||||||
|
|
|
|
|
|||||
| 93,142,296 | 65,269,569 | |||||||
| Less accumulated depreciation and amortization |
(21,786,759) | (9,170,699) | ||||||
|
|
|
|
|
|||||
| 71,355,537 | 56,098,870 | |||||||
| Deposits on equipment and equipment in process of assembly |
2,361,408 | 18,550,159 | ||||||
| Land |
330,603 | 818,494 | ||||||
|
|
|
|
|
|||||
| $ | 74,047,548 | $ | 75,467,523 | |||||
|
|
|
|
|
|||||
Deposits on equipment and equipment in process of assembly represents deposits placed with vendors for equipment that is in the process of assembly and purchased equipment that is being outfitted for its intended use. The equipment is not depreciated until it has been placed in service.
Depreciation expense charged to operations totaled $12,645,153 and $5,021,949 for the nine months ended September 30, 2014 and 2013, respectively.
F-79
Stingray Pressure Pumping LLC and Affiliate
NOTES TO THE CONDENSED COMBINED FINANCIAL STATEMENTS
(Unaudited)
Capitalized interest totaled $226,608 and $0 for the nine months ended September 30, 2014 and 2013, respectively.
| 5. | Long-Term Debt |
Long-term debt consists of the following:
| September 30, 2014 |
December 31, 2013 |
|||||||
| Term loans |
$ | 50,000,000 | $ | 43,424,096 | ||||
| Vehicle loans |
1,154,126 | 1,486,092 | ||||||
|
|
|
|
|
|||||
| Total long-term debt |
51,154,126 | 44,910,188 | ||||||
| Less: current maturities of long-term debt |
(15,067,432) | (16,702,602) | ||||||
|
|
|
|
|
|||||
| Long-term debt less current maturities |
$ | 36,086,694 | $ | 28,207,586 | ||||
|
|
|
|
|
|||||
On July 3, 2013, the Company entered into a $50,000,000 term loan with a third party lender. The loan subjects the Company to certain financial reporting requirements and financial covenants. The loan requires maintenance of a minimum tangible net worth of $30,000,000. The loan also requires that debt to tangible net worth not to exceed 1.75 to 1.00. The loan is secured by certain specified equipment. The loan matures over 36 months and requires a monthly payments of principal and interest. As of September 30, 2014, the monthly payments were $1,488,000.
On September 30, 2014, the Company entered into the first modification to the loan agreement. The modification resulted in the borrowing of an additional $18,699,519, increasing outstanding balance of the term loan to $50,000,000. The modification also extended the maturity date to November 1, 2017. The loans bears interest at the rate of New York Prime Rate plus 0.75% and is subject to a floor of 4.50%. The outstanding balance at September 30, 2014 and December 31, 2013 was $50,000,000 and $43,424,096, respectively. The interest rate at September 30, 2014 was 4.50%. The Company was in compliance with the financial covenants at September 30, 2014.
On various dates between November 26, 2012 and September 25, 2013, the Company entered into borrowing agreements to finance the purchase of certain vehicles and trailers. The agreements are secured by certain specified vehicles. The cost of the vehicles and trailers serving as collateral for the borrowing agreements was $3,224,465 at September 30, 2014. The loan agreements are for 48 months and require monthly payments of principal and interest. As of September 30, 2014, the monthly payments were $43,312. The outstanding balance at September 30, 2014 and December 31, 2013 was $1,154,126 and $1,486,092, respectively. The interest rates on the loans are fixed and range from 5.25% to 5.99%.
| 6. | Members’ Equity |
Both Pressure Pumping and Logistics operate under a limited liability company agreement (the “Agreement”) and will continue perpetually until terminated pursuant to statute or any provision of the Agreements. No member shall be liable for the expenses, liabilities or obligations of the Company.
Each Agreement provides for specific voting rights of the members. For matters that require vote, members shall have one vote for each whole percentage interest held by the member at the time of vote. Distributions and profit and loss allocations are based on the pro rata share of each member’s ownership percentages.
F-80
Stingray Pressure Pumping LLC and Affiliate
NOTES TO THE CONDENSED COMBINED FINANCIAL STATEMENTS
(Unaudited)
Each Agreement places limits on the transfer of members’ interests. Encumbrances are prohibited unless they are a Permitted Encumbrance, as defined in the Agreement.
| 7. | Commitments and Contingencies |
The Company is, from time to time, involved in routine litigation or subject to disputes or claims related to business activities, including workers’ compensation claims and employment related disputes. In the opinion of management, none of the pending litigation, disputes or claims against the Company, if decided adversely, is expected to have a material effect on the Company’s financial condition, results of operations, or cash flows.
The Company has entered into contracts with a certain key employee that in the event of either an initial public offering (“IPO”) or sale of substantially all of the assets of the Company to a third party buyer this employee would receive a cash payment in the amount of 1% of the difference between the net proceeds from a sale of the Company and the total investment in the Company of its owners or a stock grant in the event of an IPO. The amount of any grant of stock would be determined by the Company’s approved stock plan.
The Company has no firm purchase commitments for equipment as of September 30, 2014 or December 31, 2013.
| 8. | Equity-Based Compensation |
Upon formation of each Stingray entity, specified members of management were granted the right to receive capital distributions under the various Agreements, after each contributing member’s unreturned capital balance is reduced to zero—referred to as “Pay-out”. The specified member’s right to receive a post Pay-out distribution is generally subject to continued employment. The Company has valued the post Pay-out distribution rights using the option pricing method as of the grant dates that coincide with the formation of the respective entities. The exercise price was based on the contributing members’ contributions at the formation date. No dividend yield was included because the Company does not plan to pay dividends. For Pressure Pumping, valuation assumptions included a risk free interest rate of 0.95%, expected life of four years, and an expected volatility of 49.39%. For Logistics, valuation assumptions included a risk free interest rate of 0.47%, an expected life of four years, and an expected volatility of 45.91%. No compensation cost has been recognized for the six months ended September 30, 2014 or 2013, because Pay-out was not deemed probable, and the post Pay-out right does not vest until Pay-out is reached. At September 30, 2014, the Company had $1,579,051 in unrecognized compensation costs associated with these post Pay-out distribution rights.
| 9. | Related Party Transactions |
The Company provides certain services to Gulfport Energy Corporation, a principal member of the Company (“Gulfport”). For the nine months ended September 30, 2014 and 2013, $85,574,015 and $55,788,653, respectively, of the Company’s revenues were generated through transactions with Gulfport. Accounts receivable from Gulfport as of September 30, 2014 and December 31, 2013 were $8,746,915 and $8,237,652 respectively.
Gulfport provided certain administrative and payroll services to the Company under a shared services agreement. These amounts totaled $94,924 and $346,356 for the nine months ended September 30, 2014 and 2013, respectively. During the nine months ended September 30, 2014 and 2013, the entire amount was for
F-81
Stingray Pressure Pumping LLC and Affiliate
NOTES TO THE CONDENSED COMBINED FINANCIAL STATEMENTS
(Unaudited)
selling, general and administrative activities. As of September 30, 2014 and December 31, 2013, the Company had an outstanding accounts payable balance of $36,145 and $0, respectively, with Gulfport.
The Company purchases sand used in its hydraulic fracturing operations from an affiliate. During the nine months ended September 30, 2014 and September 30, 2013, the Company purchased $6,196,956 and $7,237,786, respectively, in sand. For the nine months ended September 30, 2014, $5,657,187 was included in cost of services revenue activities and $539,769 was included in inventory. For the nine months ended September 30, 2013, the entire amount is included in cost of services revenue activities. As of September 30, 2014 and December 31, 2013, related party accounts payable included $4,671,662 and $1,576,199, respectively.
The Company purchases sand used in its Gulfport and hydraulic fracturing operations from an affiliate, which was purchased by Wexford in September 2014. Sand purchases subsequent to the acquisition through September 30, 2014 totaled $470,748 and the entire amount is included in cost of services revenue activities. As of September 30, 2014, related party accounts payable included $2,056,840 due to the affiliate.
The Company paid certain costs on behalf of the affiliate which are passed through. At September 30, 2014 accounts receivable included $130,600 from this affiliate.
The Company rented certain equipment used in its hydraulic fracturing operations from an affiliate. During the nine months ended September 30, 2014 and September 30, 2013, the Company rented $42,000 and $41,980, respectively, in equipment from the affiliate and the entire amount is included in cost of services revenue activities. As of September 30, 2014 and December 31, 2013, related party accounts payable included $25,422 and $65,410, respectively, payable to the affiliate.
The Company provided certain administrative and payroll services to the affiliate. These amounts totaled $49,409 and $0 for the nine months ended September 30, 2014 and 2013, respectively. As of September 30, 2014 and December 31, 2013, related party accounts receivable included $59,077 and $0, respectively, receivable from the affiliate.
The Company rented certain equipment used in its hydraulic fracturing operations from an affiliate. These amounts totaled $62,021 and $16,359 for the nine months ended September 30, 2014 and 2013, respectively and the entire amount is included in cost of services revenue activities. The Company also provides certain management, administrative, and treasury functions to the affiliate. Additionally, during the nine months ended September 30, 2014 and 2013, the Company paid $127,720 and $77,227, respectively, of payroll expenses related to these services which were passed through to the affiliate. The Company also pays certain other costs on behalf of the affiliate which are passed through to the affiliate. As of September 30, 2014 and December 31, 2013, related party accounts receivable included $0 and $1,675,951, respectively, receivable from the affiliate. As of September 30, 2014 and December 31, 2013, related party accounts payable included $490,045 and $0, respectively, due to the affiliate.
The Company provides certain services to an affiliate. For the nine months ended September 30, 2014 and 2013, $31,167 and $0, respectively, of the Company’s revenues were generated through transactions with the affiliate. The Company also provides certain management, administrative, and treasury functions to the affiliate. During the nine months ended September 30, 2014 and 2013, the Company paid $156,335 and $115,332, respectively, of payroll expenses related to these services which were passed through to the affiliate. The Company also pays certain other costs on behalf of the affiliate which are passed through to the affiliate. As of September 30, 2014 and December 31, 2013, related party accounts receivable included
F-82
Stingray Pressure Pumping LLC and Affiliate
NOTES TO THE CONDENSED COMBINED FINANCIAL STATEMENTS
(Unaudited)
$377,063 and $912,822, respectively, receivable from the affiliate. There were no related party balances due to the affiliate as of September 30, 2014 and December 31, 2013.
The Company pays certain costs on behalf of an affiliate which are passed through. At September 30, 2014 and December 31, 2013, accounts receivable due from the affiliate were $4,094 and $0, respectively.
The Company purchases equipment and contracts for repairs and maintenance on equipment from a former affiliate. During the nine months ended September 30, 2014 and 2013, the Company purchased equipment, including deposits for equipment not yet delivered, of $2,149,993 and $10,280,366, respectively. The Company also contracted for repairs and maintenance services during the nine months ended September 30, 2014 and September 30, 2013 of $302,193 and $1,389,211, respectively. As of September 30, 2014, the entity was no longer considered an affiliate and therefore all outstanding balances were included in accounts payable trade. As of December 31, 2013, related party accounts payable included $2,091,122 due to the affiliate.
The Company received legal and administrative services which were paid for by a certain affiliate. These amounts totaled $953,481 during the nine months ended September 30, 2014 and the entire amount is included in other noncurrent assets. There were no legal and administrative services paid for the Company by this affiliate during the nine months ended September 30, 2013. As of September 30, 2014 and December 31, 2013, related party accounts payable included $523,823 and $0, respectively, to the affiliate.
The Company received administrative services from certain affiliates. These amounts totaled $45,313 and $2,080, during the nine months ended September 30, 2014 and September 30, 2013, respectively, and the entire amount is included in selling, general and administrative activities. As of September 30, 2014 and December 31, 2013, related party accounts payable included $0 and $5,292, respectively.
The Company also provides some administrative services to certain affiliates. These amounts totaled $28,269 during the nine months ended September 30, 2014 and the entire amount is included in selling, general and administrative activities. There were no administrative services provided to these affiliates during the nine months ended September 30, 2013. As of September 30, 2014 and December 31, 2013, related party accounts receivable included $4,038 and $0, respectively, from the affiliates.
A tabular summary of transactions with related parties for the nine months ended September 30 follows:
| 2014 | 2013 | |||||||
| Revenues |
$ | 85,605,182 | $ | 55,788,653 | ||||
| Purchased materials |
$ | 6,667,704 | $ | 7,237,786 | ||||
| Purchased services |
$ | 468,773 | $ | 1,795,986 | ||||
| Capital asset purchases |
$ | 2,149,993 | $ | 10,280,366 | ||||
| 10. | Subsequent Events |
The Company has evaluated events and transactions that occurred subsequent to September 30, 2014 through July 15, 2016, the date these financials were available to be issued, noting no subsequent events or transactions that required recognition or disclosure in the financial statements, other than noted below.
On November 24, 2014 Mammoth Energy Partners, LP (“Mammoth”), an affiliate of both Wexford and Gulfport, acquired all ownership interests in Pressure Pumping and Logistics. The total amount of the consideration transferred was $183,630,000. The fair value of the Stingray entities provided as consideration was determined with the assistance of external valuation experts as of the acquisition date. As part of the consideration, Mammoth assumed all long-term debt and subsequently paid it off in 2014.
F-83
REPORT OF INDEPENDENT CERTIFIED PUBLIC ACCOUNTANTS
Members
Bison Drilling and Field Services, LLC
We have audited the accompanying Statements of Revenues and Direct Operating Expenses of Certain Drilling Rigs (the “Statements”) of Lantern Drilling Company (“Lantern Rigs”) acquired by Bison Drilling and Field Services LLC (“Bison”) for the years ended December 31, 2013 and 2012, and the related notes to the statements.
Management’s responsibility for the financial statements
Bison management is responsible for the preparation and fair presentation of these statements in accordance with accounting principles generally accepted in the United States of America; this includes the design, implementation, and maintenance of internal control relevant to the preparation and fair presentation of statements that are free from material misstatement, whether due to fraud or error.
Auditor’s responsibility
Our responsibility is to express an opinion on these statements based on our audits. We conducted our audits in accordance with auditing standards generally accepted in the United States of America. Those standards require that we plan and perform the audit to obtain reasonable assurance about whether the statements are free from material misstatement.
An audit involves performing procedures to obtain audit evidence about the amounts and disclosures in the statements. The procedures selected depend on the auditor’s judgment, including the assessment of the risks of material misstatement of the statements, whether due to fraud or error. In making those risk assessments, the auditor considers internal control relevant to the entity’s preparation and fair presentation of the statements in order to design audit procedures that are appropriate in the circumstances, but not for the purpose of expressing an opinion on the effectiveness of the entity’s internal control. Accordingly, we express no such opinion. An audit also includes evaluating the appropriateness of accounting policies used and the reasonableness of significant accounting estimates made by management, as well as evaluating the overall presentation of the statements.
We believe that the audit evidence we have obtained is sufficient and appropriate to provide a basis for our audit opinion.
Opinion
In our opinion, the statements referred to above present fairly, in all material respects, the revenues and direct operating expenses of the Lantern Rigs as described in Note A for the years ended December 31,2013 and 2012, in accordance with accounting principles generally accepted in the United States of America.
Emphasis of Matter
As described in Note A, the accompanying statements are prepared for the purpose of complying with the rules and regulations of the Securities and Exchange Commission and are not intended to be a complete financial presentation of the Lantern Rigs’ revenues and expenses. Our opinion is not modified with respect to this matter.
/s/ GRANT THORNTON LLP
Oklahoma City, Oklahoma
May 14, 2014
F-84
LANTERN DRILLING COMPANY
STATEMENTS OF REVENUES AND DIRECT OPERATING EXPENSES
| Year Ended December 31, | ||||||||
| 2013 | 2012 | |||||||
| Revenues: |
||||||||
| Contract drilling services revenue |
$ | 33,101,567 | $ | 31,713,240 | ||||
| Direct operating expenses: |
||||||||
| Contract drilling operating expenses |
22,228,925 | 21,798,694 | ||||||
| Operating lease rental expense |
13,602,448 | 13,434,164 | ||||||
| General and administrative expenses |
497,221 | 252,900 | ||||||
|
|
|
|
|
|||||
| 36,328,594 | 35,485,758 | |||||||
|
|
|
|
|
|||||
| Direct operating expenses in excess of revenues |
$ | (3,227,027 | ) | $ | (3,772,518 | ) | ||
|
|
|
|
|
|||||
See accompanying notes to statements of revenues and direct operating expenses.
F-85
LANTERN DRILLING COMPANY
NOTES TO STATEMENTS OF REVENUES AND DIRECT OPERATING EXPENSES
FOR THE YEARS ENDED DECEMBER 31, 2013 AND 2012
NOTE A—BASIS OF PRESENTATION
The accompanying statements present the revenues and direct operating expenses for five drilling rigs (the “Rigs”) that were operated by Lantern Drilling Company (“Lantern”) in Texas and Louisiana during the years ended December 31, 2013 and 2012. Lantern is a wholly-owned subsidiary of Forest Oil Permian Corporation (“Forest Permian”) and provides contract land drilling services for oil and natural gas exploration and production. Forest Permian is a wholly-owned subsidiary of Forest Oil Corporation (“Forest Oil”). As discussed in Note E, the Rigs were acquired by Bison Drilling and Field Services LLC (“Bison”) on January 29, 2014.
The accompanying statements of revenues and direct operating expenses are presented on the accrual basis of accounting and were derived from the historical accounting records of Lantern. The historical statements presented are not indicative of the financial condition or results of operations of the Lantern Rigs due to the omission of certain operating expenses, and such amounts may not be indicative of future operations. The statements do not include depreciation because the Rigs were owned by third party financial institutions that leased the Rigs to Forest Oil under operating leases and Forest Oil sub-leased the Rigs to Lantern. The statements also do not include corporate overhead, interest expense or income taxes because those costs are not directly related to revenue producing activities of the Rigs and are not separately identifiable by rig.
Historical financial statements reflecting the financial position, results of operations and cash flows required by accounting principles generally accepted in the United States of America are not presented because Lantern did not own the Rigs and such information was not available to prepare the full financial statements required by Securities and Exchange Commission Regulation S-X, Rule 3-05. Accordingly, the historical statements of revenues and direct operating expenses of the Rigs are presented in lieu of financial statements required under Rule 3-05.
NOTE B—SIGNIFICANT ACCOUNTING POLICIES
Use of estimates
The preparation of the accompanying statements in conformity with generally accepted accounting principles requires making estimates and assumptions that affect the reported amounts of revenues and direct operating expenses during the reporting period. The estimates include revenue and expense accruals and estimates for allocations of certain operating expenses to individual rigs. Actual results could materially differ from these estimates.
Revenue recognition
Lantern earns contract drilling revenue, mobilization revenue and equipment rental revenue, primarily under day work contracts. Revenues on day work contracts are recognized based on the days completed at the day rate each contract specifies.
NOTE C—RELATED PARTY TRANSACTIONS
Lantern provided drilling services to Forest Oil. For the years ended December 31, 2013 and 2012, contract drilling services revenue included $25,057,254 and $29,543,396, respectively, from Forest Oil.
Certain employees of Forest Oil provided direct management services to Lantern. General and administrative expenses in the accompanying Statements of Direct Revenues and Operating Expenses represents the management fee charged by Forest Oil to Lantern for such services. The management fee was based on payroll, benefits and overhead for the direct management employees.
F-86
CERTAIN DRILLING RIGS OF
LANTERN DRILLING COMPANY
NOTES TO STATEMENTS OF REVENUES AND DIRECT OPERATING EXPENSES
FOR THE YEARS ENDED DECEMBER 31, 2013 AND 2012—(Continued)
NOTE D—COMMITMENTS
In August 2007, Forest Oil sold one of the five rigs to a financial institution, and between June and December 2010 Forest Oil sold the other four rigs to various financial institutions. In all cases, Forest Oil leased the rigs back from the financial institutions under long-term non-cancellable operating leases having varying terms and expiration dates through July 2017. Lantern sub-leased the rigs from Forest Oil. For the years ended December 31, 2013 and 2012, Lantern recognized $13,602,448 and $13,434,164, respectively, of operating lease rental expense. The operating leases were paid in full and terminated in January 2014.
NOTE E—SUBSEQUENT EVENTS
Lantern has evaluated the period after December 31, 2013 through May 14, 2014, the date the statements of revenues and direction operating expenses were available to be issued, noting no subsequent events other than what is identified below.
On January 29, 2014, Bison, a third party, acquired the Rigs directly from the financial institutions that leased the Rigs to Lantern. The amounts paid by Bison to acquire the Rigs along with approximately $3.1 million paid by Forest Oil, were used to pay off the operating leases in their entirety and terminate the lease agreements.
F-87
Report of Independent Registered Public Accounting Firm
Board of Directors and Stockholder
Mammoth Energy Services Inc.
We have audited the accompanying balance sheet of Mammoth Energy Services Inc. (a Delaware corporation) (the “Company”) as of June 30, 2016. This financial statement is the responsibility of the Company’s management. Our responsibility is to express an opinion on this financial statement based on our audit.
We conducted our audit in accordance with the standards of the Public Company Accounting Oversight Board (United States). Those standards require that we plan and perform the audit to obtain reasonable assurance about whether the financial statement is free of material misstatement. We were not engaged to perform an audit of the Company’s internal control over financial reporting. Our audit included consideration of internal control over financial reporting as a basis for designing audit procedures that are appropriate in the circumstances, but not for the purpose of expressing an opinion on the effectiveness of the Company’s internal control over financial reporting. Accordingly, we express no such opinion. An audit also includes examining, on a test basis, evidence supporting the amounts and disclosures in the financial statements, assessing the accounting principles used and significant estimates made by management, as well as evaluating the overall financial statement presentation. We believe that our audit provides a reasonable basis for our opinion.
In our opinion, the financial statement referred to above presents fairly, in all material respects, the financial position of Mammoth Energy Services Inc. as of June 30, 2016 in conformity with accounting principles generally accepted in the United States of America.
/s/ GRANT THORNTON LLP
Oklahoma City, Oklahoma
July 15, 2016
F-88
BALANCE SHEET
| June 30, 2016 |
||||
| ASSETS | ||||
| CURRENT ASSETS |
||||
| Cash |
$ | 1,000 | ||
|
|
|
|||
| Total assets |
$ | 1,000 | ||
|
|
|
|||
| LIABILITIES AND SHAREHOLDERS’ EQUITY | ||||
| CURRENT LIABILITIES |
||||
| Payable to related party |
$ | 900 | ||
|
|
|
|||
| Total liabilities |
900 | |||
|
|
|
|||
| STOCKHOLDERS’ EQUITY | ||||
| STOCKHOLDERS’ EQUITY |
||||
| Stockholders’ Equity: |
||||
| Common stock, $0.01 par value; 100 shares authorized; |
||||
| 100 shares issued and outstanding at June 30, 2016 |
1 | |||
| Additional paid-in capital |
99 | |||
|
|
|
|||
| Total stockholders’ equity |
100 | |||
|
|
|
|||
| Total liabilities and stockholders’ equity |
$ | 1,000 | ||
|
|
|
|||
The accompanying notes are an integral part of this financial statement.
F-89
NOTES TO FINANCIAL STATEMENT
| 1. | Organization and Basis of Presentation |
Mammoth Energy Services Inc. (“Mammoth”) is a corporation formed under the laws of the State of Delaware on June 3, 2016. Mammoth intends to offer common stock pursuant to an initial public offering. Immediately prior to the effectiveness of the registration statement, Mammoth Energy Partners LP will convert to a Delaware limited liability company named Mammoth Energy Partners LLC (“Mammoth Partners LLC”) and Mammoth Holdings LLC, Gulfport Energy Corporation and Rhino Resource Partners LP will contribute their respective interests in Mammoth Partners LLC to Mammoth and Mammoth Partners LLC will become a wholly owned subsidiary.
This balance sheet has been prepared in accordance with accounting principles generally accepted in the United States.
Through June 30, 2016, Mammoth had not earned any revenue and had not incurred any expenses; therefore, the statements of income, stockholders’ equity and cash flows have been omitted. There have been no other transactions involving Mammoth as of June 30, 2016.
| 2. | Summary of Significant Accounting Policies |
(a) Cash and Cash Equivalents
All highly liquid investments with an original maturity of three months or less are considered cash equivalents. The Partnership maintains its cash accounts in financial institutions that are insured by the Federal Deposit Insurance Corporation. Cash balances from time to time may exceed the insured amounts; however the Partnership has not experienced any losses in such accounts and does not believe it is exposed to any significant credit risks on such accounts.
| 3. | Subsequent Events |
Mammoth has evaluated the period after June 30, 2016 through July 15, 2016, the date the financial statement was available to be issued, noting no subsequent events or transactions that required recognition or disclosure in the financial statement.
F-90
Dealer Prospectus Delivery Obligation
Until , 2016 (25 days after commencement of this offering), all dealers that effect transactions in these securities, whether or not participating in this offering, may be required to deliver a prospectus. This is in addition to the dealer’s obligation to deliver a prospectus when acting as an underwriter and with respect to unsold allotments or subscriptions.
PART II
INFORMATION NOT REQUIRED IN PROSPECTUS
Item 13. Other Expenses of Issuance and Distribution.
The following table sets forth the fees and expenses in connection with the issuance and distribution of the securities being registered hereunder. Except for the SEC registration fee and FINRA filing fee, all amounts are estimates.
| SEC registration fee |
$ | 10,070 | ||
| FINRA filing fee |
$ | 15,500 | ||
| NASDAQ Global Market listing fee |
25,000 | |||
| Accounting fees and expenses |
* | |||
| Legal fees and expenses |
* | |||
| Blue Sky fees and expenses (including counsel fees) |
* | |||
| Printing and Engraving expenses |
* | |||
| Transfer Agent and Registrar fees and expenses |
* | |||
| Miscellaneous expenses |
* | |||
|
|
|
|||
| Total |
$ | * | ||
|
|
|
| * | To be completed by amendment. |
Item 14. Indemnification of Directors and Officers.
Limitation of Liability
Section 102(b)(7) of the DGCL permits a corporation, in its certificate of incorporation, to limit or eliminate, subject to certain statutory limitations, the liability of directors to the corporation or its stockholders for monetary damages for breaches of fiduciary duty, except for liability:
| • | for any breach of the director’s duty of loyalty to the company or its stockholders; |
| • | for acts or omissions not in good faith or that involve intentional misconduct or a knowing violation of law; |
| • | in respect of certain unlawful dividend payments or stock redemptions or repurchases; and |
| • | for any transaction from which the director derives an improper personal benefit. |
In accordance with Section 102(b)(7) of the DGCL, Section 9.1 of our certificate of incorporation provides that that no director shall be personally liable to us or any of our stockholders for monetary damages resulting from breaches of their fiduciary duty as directors, except to the extent such limitation on or exemption from liability is not permitted under the DGCL. The effect of this provision of our certificate of incorporation is to eliminate our rights and those of our stockholders (through stockholders’ derivative suits on our behalf) to recover monetary damages against a director for breach of the fiduciary duty of care as a director, including breaches resulting from negligent or grossly negligent behavior, except, as restricted by Section 102(b)(7) of the DGCL. However, this provision does not limit or eliminate our rights or the rights of any stockholder to seek non-monetary relief, such as an injunction or rescission, in the event of a breach of a director’s duty of care.
If the DGCL is amended to authorize corporate action further eliminating or limiting the liability of directors, then, in accordance with our certificate of incorporation, the liability of our directors to us or our
II-1
stockholders will be eliminated or limited to the fullest extent authorized by the DGCL, as so amended. Any repeal or amendment of provisions of our certificate of incorporation limiting or eliminating the liability of directors, whether by our stockholders or by changes in law, or the adoption of any other provisions inconsistent therewith, will (unless otherwise required by law) be prospective only, except to the extent such amendment or change in law permits us to further limit or eliminate the liability of directors on a retroactive basis.
Indemnification
Section 145 of the DGCL permits a corporation, under specified circumstances, to indemnify its directors, officers, employees or agents against expenses (including attorneys’ fees), judgments, fines and amounts paid in settlements actually and reasonably incurred by them in connection with any action, suit or proceeding brought by third parties by reason of the fact that they were or are directors, officers, employees or agents of the corporation, if such directors, officers, employees or agents acted in good faith and in a manner they reasonably believed to be in or not opposed to the best interests of the corporation and, with respect to any criminal action or proceeding, had no reason to believe their conduct was unlawful. In a derivative action, i.e., one by or in the right of the corporation, indemnification may be made only for expenses actually and reasonably incurred by directors, officers, employees or agents in connection with the defense or settlement of an action or suit, and only with respect to a matter as to which they shall have acted in good faith and in a manner they reasonably believed to be in or not opposed to the best interests of the corporation, except that no indemnification shall be made if such person shall have been adjudged liable to the corporation, unless and only to the extent that the court in which the action or suit was brought shall determine upon application that the defendant directors, officers, employees or agents are fairly and reasonably entitled to indemnity for such expenses despite such adjudication of liability.
Our certificate of incorporation provides that we will, to the fullest extent authorized or permitted by applicable law, indemnify our current and former directors and officers, as well as those persons who, while directors or officers of our corporation, are or were serving as directors, officers, employees or agents of another entity, trust or other enterprise, including service with respect to an employee benefit plan, in connection with any threatened, pending or completed proceeding, whether civil, criminal, administrative or investigative, against all expense, liability and loss (including, without limitation, attorney’s fees, judgments, fines, ERISA excise taxes and penalties and amounts paid in settlement) reasonably incurred or suffered by any such person in connection with any such proceeding. Notwithstanding the foregoing, a person eligible for indemnification pursuant to our certificate of incorporation will be indemnified by us in connection with a proceeding initiated by such person only if such proceeding was authorized by our board of directors, except for proceedings to enforce rights to indemnification.
The right to indemnification conferred by our certificate of incorporation is a contract right that includes the right to be paid by us the expenses incurred in defending or otherwise participating in any proceeding referenced above in advance of its final disposition, provided, however, that if the DGCL requires, an advancement of expenses incurred by our officer or director (solely in the capacity as an officer or director of our corporation) will be made only upon delivery to us of an undertaking, by or on behalf of such officer or director, to repay all amounts so advanced if it is ultimately determined that such person is not entitled to be indemnified for such expenses under our certificate of incorporation or otherwise.
The rights to indemnification and advancement of expenses will not be deemed exclusive of any other rights which any person covered by our certificate of incorporation may have or hereafter acquire under law, our certificate of incorporation, our bylaws, an agreement, vote of stockholders or disinterested directors, or otherwise.
Any repeal or amendment of provisions of our certificate of incorporation affecting indemnification rights, whether by our stockholders or by changes in law, or the adoption of any other provisions inconsistent therewith, will (unless otherwise required by law) be prospective only, except to the extent such amendment or change in law permits us to provide broader indemnification rights on a retroactive basis, and will not in any way diminish
II-2
or adversely affect any right or protection existing at the time of such repeal or amendment or adoption of such inconsistent provision with respect to any act or omission occurring prior to such repeal or amendment or adoption of such inconsistent provision. Our certificate of incorporation also permits us, to the extent and in the manner authorized or permitted by law, to indemnify and to advance expenses to persons other that those specifically covered by our certificate of incorporation.
Our bylaws include the provisions relating to advancement of expenses and indemnification rights consistent with those set forth in our certificate of incorporation. In addition, our bylaws provide for a right of indemnitee to bring a suit in the event a claim for indemnification or advancement of expenses is not paid in full by us within a specified period of time. Our bylaws also permit us to purchase and maintain insurance, at our expense, to protect us and/or any director, officer, employee or agent of our corporation or another entity, trust or other enterprise against any expense, liability or loss, whether or not we would have the power to indemnify such person against such expense, liability or loss under the DGCL.
Any repeal or amendment of provisions of our bylaws affecting indemnification rights, whether by our board of directors, stockholders or by changes in applicable law, or the adoption of any other provisions inconsistent therewith, will (unless otherwise required by law) be prospective only, except to the extent such amendment or change in law permits us to provide broader indemnification rights on a retroactive basis, and will not in any way diminish or adversely affect any right or protection existing thereunder with respect to any act or omission occurring prior to such repeal or amendment or adoption of such inconsistent provision.
We will enter into indemnification agreements with each of our current directors and executive officers. These agreements will require us to indemnify these individuals to the fullest extent permitted under Delaware law against liabilities that may arise by reason of their service to us, and to advance expenses incurred as a result of any proceeding against them as to which they could be indemnified. We also intend to enter into indemnification agreements with our future directors and executive officers.
Under the Underwriting Agreement, the underwriters are obligated, under certain circumstances, to indemnify directors and officers of the registrant against certain liabilities, including liabilities under the Securities Act. Reference is made to the form of Underwriting Agreement to be filed as Exhibit 1.1 to this Registration Statement.
Item 15. Recent Sales of Unregistered Securities.
In connection with the contribution described in this registration statement, we intend to issue shares of our common stock to Mammoth Holdings, shares of our common stock to Gulfport and shares of our common stock to Rhino, in each case prior to the effective date of this registration statement. The shares of our common stock described in this Item 15 will be issued in reliance upon the exemption from the registration requirements of the Securities Act provided by Section 4(2) of the Securities Act as sales by an issuer not involving any public offering.
II-3
Item 16. Exhibits and Financial Statement Schedules.
(A) Exhibits:
| Exhibit Number |
Number Description | |
| 1.1** | Form of Underwriting Agreement. | |
| 3.1* | Certificate of Incorporation of the Company. | |
| 3.2** | Form of proposed Amended and Restated Certificate of Incorporation to be effective immediately upon the closing of the offering made pursuant to this registration statement. | |
| 3.3* | Bylaws of the Company. | |
| 3.4** | Form of proposed Bylaws to be effective immediately upon the closing of the offering made pursuant to this registration statement. | |
| 4.1** | Specimen Certificate for shares of common stock, par value $0.01 per share, of the Company. | |
| 4.2* | Form of Registration Rights Agreement by and between the Company and Mammoth Energy Holdings LLC. | |
| 4.3* | Form of Investor Rights Agreement by and among the Company, Mammoth Energy Holdings LLC and Gulfport Energy Corporation. | |
| 4.4* | Form of Registration Rights Agreement by and between the Company and Rhino Resource Partners LP. | |
| 5.1** | Form of Opinion of Akin Gump Strauss Hauer & Feld LLP as to the legality of the securities being registered. | |
| 10.1* | Form of Advisory Services Agreement by and between the Company and Wexford Capital LP. | |
| 10.2*** | Master Service Contract, effective May 16, 2013, by and between Muskie Proppant LLC and Diamondback E&P LLC. | |
| 10.3*** | Master Service Agreement, dated February 22, 2013, by and between Gulfport Energy Corporation and Panther Drilling Systems LLC. | |
| 10.4*** | Amendment to Master Service Agreement, dated as of May 23, 2016, by and among Gulfport Energy Corporation, Gulfport Buckeye LLC and Panther Drilling Systems LLC. | |
| 10.5*** | Master Service Contract, effective September 9, 2013, by and between Panther Drilling Systems LLC and Diamondback E&P LLC. | |
| 10.6*** | First Amendment, dated February 21, 2013, to Master Field Services Agreement, effective January 1, 2013, by and between Diamondback E&P LLC and Bison Drilling and Field Services LLC. | |
| 10.7*** | Master Field Services Agreement, effective January 1, 2013, by and between Diamondback E&P LLC and Bison Drilling and Field Services LLC. | |
| 10.8*** | Master Drilling Agreement, effective January 1, 2013, by and between Diamondback E&P LLC and Bison Drilling and Field Services LLC. | |
| 10.9*** | Master Service Agreement, dated June 11, 2012, by and between Gulfport Energy Corporation and Redback Energy Services LLC. | |
| 10.10*** | Master Service Contract, effective October 17, 2013, by and between Bison Trucking LLC and Diamondback E&P LLC. | |
II-4
| Exhibit Number |
Number Description | |
| 10.11*† | Form of Equity Incentive Plan. | |
| 10.12*† | Form of Option Agreement. | |
| 10.13*† | Form of Restricted Stock Unit Agreement. | |
| 10.14**† | Form of Director and Officer Indemnification Agreement. | |
| 10.15***# | Amended & Restated Master Services Agreement for Pressure Pumping Services Agreement, effective as of October 1, 2014, by and between Gulfport Energy Corporation and Stingray Pressure Pumping LLC. | |
| 10.16***# | Amendment to Amended and Restated Master Services Agreement, dated as of February 18, 2016 to be effective as of January 1, 2016, by and between Gulfport Energy Corporation and Stingray Pressure Pumping LLC. | |
| 10.17*** | Amendment to Master Service Agreement, dated as of July 7, 2016, by and among Gulfport Energy Corporation, Gulfport Buckeye LLC and Stingray Pressure Pumping LLC. | |
| 10.18***# | Sand Supply Agreement, effective as of October 1, 2014, by and between Muskie Proppant LLC and Gulfport Energy Corporation. | |
| 10.19***# | Amendment to Sand Supply Agreement, dated as of November 3, 2015, by and between Muskie Proppant LLC and Gulfport Energy Corporation. | |
| 10.20* | Revolving Credit and Security Agreement, dated as of November 25, 2014, among Mammoth Energy Partners LP, Redback Energy Services LLC, Redback Coil Tubing LLC, Muskie Proppant LLC, Panther Drilling Systems LLC, Bison Drilling and Field Services LLC, Bison Trucking LLC, White Wing Tubular Services LLC, Great White Sand Tiger Lodging Ltd., Stingray Pressure Pumping LLC, Stingray Logistics LLC, collectively as the Borrowers, Mammoth Energy Inc. and Barracuda Logistics LLC, as the applicants, certain lenders from time to time party thereto and PNC Bank, National Association, as agent for the lenders. | |
| 10.21* | Joinder Agreement, dated as of March 31, 2015, by and among Mammoth Energy Partners LP, Redback Energy Services LLC, Redback Coil Tubing LLC, Muskie Proppant LLC, Panther Drilling Systems LLC, Bison Drilling and Field Services LLC, Bison Trucking LLC, White Wing Tubular Services LLC, Great White Sand Tiger Lodging Ltd., Stingray Pressure Pumping LLC, Stingray Logistics LLC, collectively as the Borrowers, Mammoth Energy Inc. and Barracuda Logistics LLC, as the applicants, certain lenders from time to time party thereto and PNC Bank, National Association, as agent for the lenders. | |
| 10.22* | Joinder Agreement, dated as of September 2, 2016, by and among Mammoth Energy Partners LP, Redback Energy Services LLC, Redback Coil Tubing LLC, Muskie Proppant LLC, Panther Drilling Systems LLC, Bison Drilling and Field Services LLC, Bison Trucking LLC, White Wing Tubular Services LLC, Great White Sand Tiger Lodging Ltd., Stingray Pressure Pumping LLC, Stingray Logistics LLC, Mammoth Energy Inc., Barracuda Logistics LLC, collectively as the Borrowers, Silverback Energy Services LLC, as applicant, certain lenders from time to time party thereto and PNC Bank, National Association, as agent for the lenders. | |
| 10.23** | Form of Contribution Agreement to be entered into by Mammoth Energy Services, Inc., Mammoth Energy Holdings LLC, Gulfport Energy Corporation and Rhino Resource Partners, LP. | |
| 21.1* | List of Significant Subsidiaries of the Company. | |
| 23.1* | Consent of Grant Thornton LLP with respect to Mammoth Energy Partners LP. | |
II-5
| Exhibit Number |
Number Description | |
| 23.2* | Consent of Grant Thornton LLP with respect to Stingray Pressure Pumping LLC and Affiliate. | |
| 23.3* | Consent of Grant Thornton LLP with respect to certain drilling rigs of Lantern Drilling Company. | |
| 23.4* | Consent of Grant Thornton LLP with respect to Mammoth Energy Services, Inc. | |
| 23.5** | Consent of Akin Gump Strauss Hauer & Feld LLP (included in Exhibit 5.1). | |
| 24.1*** | Power of Attorney. | |
| 99.1* | Consent of Aaron Gaydosik to being named as a director nominee. | |
| 99.2* | Consent of André Weiss to being named as a director nominee. | |
| 99.3* | Consent of Arthur Smith to being named as a director nominee. | |
| 99.4* | Consent of Arty Straehla to being named as a director nominee. | |
| * | Filed herewith. |
| ** | To be filed by amendment. |
| *** | Previously filed. |
| † | Management contract, compensatory plan or arrangement. |
| # | Confidential treatment requested as to certain portions, which portions have been omitted and filed separately with the Securities and Exchange Commission. |
(B) Financial Statement Schedules.
All schedules are omitted because the required information is (i) not applicable, (ii) not present in amounts sufficient to require submission of the schedule or (iii) included in our financial statements and the accompanying notes included in the prospectus to this Registration Statement.
Item 17. Undertakings.
The undersigned Registrant hereby undertakes to provide to the underwriters at the closing specified in the underwriting agreements, certificates in such denominations and registered in such names as required by the underwriters to permit prompt delivery to each purchaser.
Insofar as indemnification by the Registrant for liabilities arising under the Securities Act may be permitted to directors, officers and controlling persons of the Registrant pursuant to the foregoing provisions, or otherwise, the Registrant has been advised that in the opinion of the SEC such indemnification is against public policy as expressed in the Securities Act and is, therefore, unenforceable. In the event that a claim for indemnification against such liabilities (other than the payment by the Registrant of expenses incurred or paid by a director, officer, or controlling person of the Registrant in the successful defense of any action, suit or proceeding) is asserted by such director, officer, or controlling person in connection with the securities being registered hereunder, the Registrant will, unless in the opinion of its counsel the matter has been settled by controlling precedent, submit to a court of appropriate jurisdiction the question whether such indemnification by it is against public policy as expressed in the Securities Act and will be governed by the final adjudication of such issue.
The Registrant hereby undertakes that:
(1) For purposes of determining any liability under the Securities Act, the information omitted from the form of prospectus filed as part of this Registration Statement in reliance upon Rule 430A and contained in a form of prospectus filed by the Registrant pursuant to Rule 424(b)(1) or (4) or 497(h) under the Securities Act shall be deemed to be part of this Registration Statement as of the time it was declared effective.
(2) For the purpose of determining any liability under the Securities Act, each post-effective amendment that contains a form of prospectus shall be deemed to be a new registration statement relating to the securities offered therein, and the offering of such securities at that time shall be deemed to be the initial bona fide offering thereof.
II-6
SIGNATURES
Pursuant to the requirements of the Securities Act of 1933, the Registrant has duly caused this Registration Statement to be signed on its behalf by the undersigned, thereunto duly authorized, in Oklahoma City, Oklahoma, on September 22, 2016.
| MAMMOTH ENERGY SERVICES, INC. | ||
| By: | /s/ Arty Straehla | |
| Arty Straehla Chief Executive Officer | ||
Pursuant to the requirements of the Securities Act of 1933, this Registration Statement has been signed by the following persons in the capacities indicated on September 22, 2016.
| Signature |
Title | |
| /s/ Arty Straehla Arty Straehla |
Chief Executive Officer (Principal Executive Officer) | |
| * Marc McCarthy |
Chairman of the Board and Director | |
| /s/ Mark Layton Mark Layton |
Chief Financial Officer (Principal Financial and Accounting Officer) | |
| *By: | /s/ Mark Layton | |
| Mark Layton Attorney-in-Fact |
S-1
EXHIBIT INDEX
| Exhibit Number |
Number Description | |
| 1.1** | Form of Underwriting Agreement. | |
| 3.1* | Certificate of Incorporation of the Company. | |
| 3.2** | Form of proposed Amended and Restated Certificate of Incorporation to be effective immediately upon the closing of the offering made pursuant to this registration statement. | |
| 3.3* | Bylaws of the Company. | |
| 3.4** | Form of proposed Bylaws to be effective immediately upon the closing of the offering made pursuant to this registration statement. | |
| 4.1** | Specimen Certificate for shares of common stock, par value $0.01 per share, of the Company. | |
| 4.2* | Form of Registration Rights Agreement by and between the Company and Mammoth Energy Holdings LLC. | |
| 4.3* | Form of Investor Rights Agreement by and among the Company, Mammoth Energy Holdings LLC and Gulfport Energy Corporation. | |
| 4.4* | Form of Registration Rights Agreement by and between the Company and Rhino Resource Partners LP. | |
| 5.1** | Form of Opinion of Akin Gump Strauss Hauer & Feld LLP as to the legality of the securities being registered. | |
| 10.1* | Form of Advisory Services Agreement by and between the Company and Wexford Capital LP. | |
| 10.2*** | Master Service Contract, effective May 16, 2013, by and between Muskie Proppant LLC and Diamondback E&P LLC. | |
| 10.3*** | Master Service Agreement, dated February 22, 2013, by and between Gulfport Energy Corporation and Panther Drilling Systems LLC. | |
| 10.4*** | Amendment to Master Service Agreement, dated as of May 23, 2016, by and among Gulfport Energy Corporation, Gulfport Buckeye LLC and Panther Drilling Systems LLC. | |
| 10.5*** | Master Service Contract, effective September 9, 2013, by and between Panther Drilling Systems LLC and Diamondback E&P LLC. | |
| 10.6*** | First Amendment, dated February 21, 2013, to Master Field Services Agreement, effective January 1, 2013, by and between Diamondback E&P LLC and Bison Drilling and Field Services LLC. | |
| 10.7*** | Master Field Services Agreement, effective January 1, 2013, by and between Diamondback E&P LLC and Bison Drilling and Field Services LLC. | |
| 10.8*** | Master Drilling Agreement, effective January 1, 2013, by and between Diamondback E&P LLC and Bison Drilling and Field Services LLC. | |
| 10.9*** | Master Service Agreement, dated June 11, 2012, by and between Gulfport Energy Corporation and Redback Energy Services LLC. | |
| 10.10*** | Master Service Contract, effective October 17, 2013, by and between Bison Trucking LLC and Diamondback E&P LLC. | |
E-1
| Exhibit Number |
Number Description | |
| 10.11*† | Form of Equity Incentive Plan. | |
| 10.12*† | Form of Option Agreement. | |
| 10.13*† | Form of Restricted Stock Unit Agreement. | |
| 10.14**† | Form of Director and Officer Indemnification Agreement. | |
| 10.15***# | Amended & Restated Master Services Agreement for Pressure Pumping Services Agreement, effective as of October 1, 2014, by and between Gulfport Energy Corporation and Stingray Pressure Pumping LLC. | |
| 10.16***# | Amendment to Amended and Restated Master Services Agreement, dated as of February 18, 2016 to be effective as of January 1, 2016, by and between Gulfport Energy Corporation and Stingray Pressure Pumping LLC. | |
| 10.17*** | Amendment to Master Service Agreement, dated as of July 7, 2016, by and among Gulfport Energy Corporation, Gulfport Buckeye LLC and Stingray Pressure Pumping LLC. | |
| 10.18***# | Sand Supply Agreement, effective as of October 1, 2014, by and between Muskie Proppant LLC and Gulfport Energy Corporation. | |
| 10.19***# | Amendment to Sand Supply Agreement, dated as of November 3, 2015, by and between Muskie Proppant LLC and Gulfport Energy Corporation. | |
| 10.20* | Revolving Credit and Security Agreement, dated as of November 25, 2014, among Mammoth Energy Partners LP, Redback Energy Services LLC, Redback Coil Tubing LLC, Muskie Proppant LLC, Panther Drilling Systems LLC, Bison Drilling and Field Services LLC, Bison Trucking LLC, White Wing Tubular Services LLC, Great White Sand Tiger Lodging Ltd., Stingray Pressure Pumping LLC, Stingray Logistics LLC, collectively as the Borrowers, Mammoth Energy Inc. and Barracuda Logistics LLC, as the applicants, certain lenders from time to time party thereto and PNC Bank, National Association, as agent for the lenders. | |
| 10.21* | Joinder Agreement, dated as of March 31, 2015, by and among Mammoth Energy Partners LP, Redback Energy Services LLC, Redback Coil Tubing LLC, Muskie Proppant LLC, Panther Drilling Systems LLC, Bison Drilling and Field Services LLC, Bison Trucking LLC, White Wing Tubular Services LLC, Great White Sand Tiger Lodging Ltd., Stingray Pressure Pumping LLC, Stingray Logistics LLC, collectively as the Borrowers, Mammoth Energy Inc. and Barracuda Logistics LLC, as the applicants, certain lenders from time to time party thereto and PNC Bank, National Association, as agent for the lenders. | |
| 10.22* | Joinder Agreement, dated as of September 2, 2016, by and among Mammoth Energy Partners LP, Redback Energy Services LLC, Redback Coil Tubing LLC, Muskie Proppant LLC, Panther Drilling Systems LLC, Bison Drilling and Field Services LLC, Bison Trucking LLC, White Wing Tubular Services LLC, Great White Sand Tiger Lodging Ltd., Stingray Pressure Pumping LLC, Stingray Logistics LLC, Mammoth Energy Inc., Barracuda Logistics LLC, collectively as the Borrowers, Silverback Energy Services LLC, as applicant, certain lenders from time to time party thereto and PNC Bank, National Association, as agent for the lenders. | |
| 10.23** | Form of Contribution Agreement to be entered into by Mammoth Energy Services, Inc., Mammoth Energy Holdings LLC, Gulfport Energy Corporation and Rhino Resource Partners, LP. | |
| 21.1* | List of Significant Subsidiaries of the Company. | |
| 23.1* | Consent of Grant Thornton LLP with respect to Mammoth Energy Partners LP. | |
E-2
| Exhibit Number |
Number Description | |
| 23.2* | Consent of Grant Thornton LLP with respect to Stingray Pressure Pumping LLC and Affiliate. | |
| 23.3* | Consent of Grant Thornton LLP with respect to certain drilling rigs of Lantern Drilling Company. | |
| 23.4* | Consent of Grant Thornton LLP with respect to Mammoth Energy Services, Inc. | |
| 23.5** | Consent of Akin Gump Strauss Hauer & Feld LLP (included in Exhibit 5.1). | |
| 24.1*** | Power of Attorney. | |
| 99.1* | Consent of Aaron Gaydosik to being named as a director nominee. | |
| 99.2* | Consent of André Weiss to being named as a director nominee. | |
| 99.3* | Consent of Arthur Smith to being named as a director nominee. | |
| 99.4* | Consent of Arty Straehla to being named as a director nominee. | |
| * | Filed herewith. |
| ** | To be filed by amendment. |
| *** | Previously filed. |
| † | Management contract, compensatory plan or arrangement. |
| # | Confidential treatment requested as to certain portions, which portions have been omitted and filed separately with the Securities and Exchange Commission. |
E-3